U.S. natural gas market trends from 2018 are expected to continue this year into 2020, including relatively stable Henry Hub natural gas prices and increasing natural gas production and exports, according to the U.S. Energy Information Administration (EIA).
The agency’s 2019 Short-Term Energy Outlook predicts total U.S. natural gas consumption is expected to increase slightly through 2020, with increases in the electric and industrial sectors offsetting decreases in the residential and commercial sectors.
U.S. benchmark Henry Hub
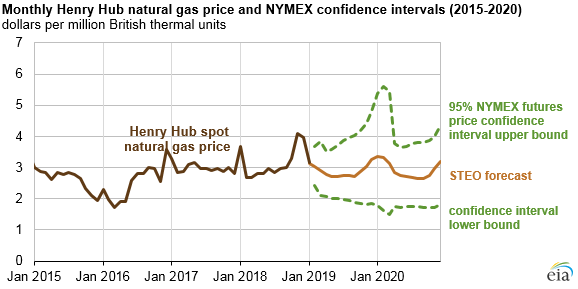
EIA expects the U.S. benchmark Henry Hub natural gas spot price to average $2.89 per million British thermal units (MMBtu) this year and $2.92 MMBtu in 2020, about 25 cents lower than the 2018 average of $3.15 MMBtu.
Prices in the forecast are expected to be comparable with recent years as production growth largely keeps pace with demand and export growth. Recent trading suggests that a range of $1.85 MMBtu to $4.80 MMBtu encompasses the market expectation for Henry Hub prices in December 2019 at the 95-percent confidence level.
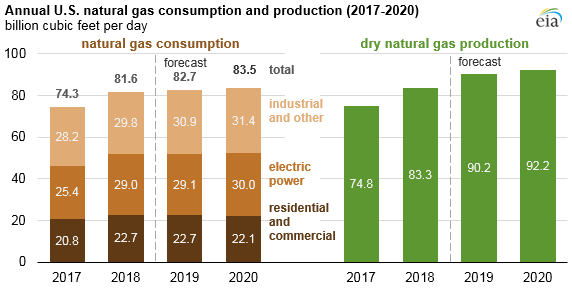
Annual US Natural Gas Consumption and Production (2017-2020) EIA
Enjoying our insights?
Subscribe to our newsletter to keep up with the latest industry trends and developments.
Stay InformedEIA expects record-high dry U.S. natural gas production to continue to grow through 2020, from an estimated 83.3 billion cubic feet per day (Bcf/d) in 2018 to 90.2 Bcf/d in 2019 and 92.2 Bcf/d in 2020. Most U.S. production will come from the Appalachian Basin in the Northeast, followed by the Permian Basin in West Texas and eastern New Mexico and the Haynesville shale formation in East Texas.
Factors supporting continued production growth include improved drilling efficiency and cost reductions in drilling and well completions, as well as increased takeaway capacity from the highly productive Appalachia and Permian production regions.
Total Consumption Remains Flat
Total U.S. natural gas consumption remains relatively flat compared with 2018 levels in the STEO forecast, increasing 1.3 percent this year and 1.1 percent in 2020 to a total of 83.6 Bcf/d in 2020. Natural gas consumption is projected to decrease slightly in the residential and commercial sectors, as expected milder weather will require less energy for space heating in the winter and air conditioning in the summer, largely based on temperature projections from the National Oceanic and Atmospheric Administration.
Decreases in those sectors will be offset by increased consumption in both the electric power and industrial sectors, both of which have added equipment or changed processes to consume more natural gas.
EIA expects a net increase in U.S. natural gas use in the electric power sector between 2018 and 2020 as natural gas-fired plant additions continue to displace coal-fired generation. This year natural gas planned capacity additions will total 7.5 gigawatts (GW) in the United States, and 4.5 GW of coal-fired capacity will be taken offline.
Primary Electrical Source
Natural gas will continue as the primary source of U.S. electricity generation, increasing from 35 percent in 2018 to 37 percent in 2020. According to the EIA forecast, coal-fired electricity generation will fall from 28 percent in 2018 to 24 percent in 2020.
Natural gas consumption in the U.S. industrial sector will continue to grow, increasing 2 percent this year and 1 percent next year. This growth will be supported by new methanol plants that use natural gas feedstock, and these plants are scheduled to come online later this year and next year.
More Exports Than Imports
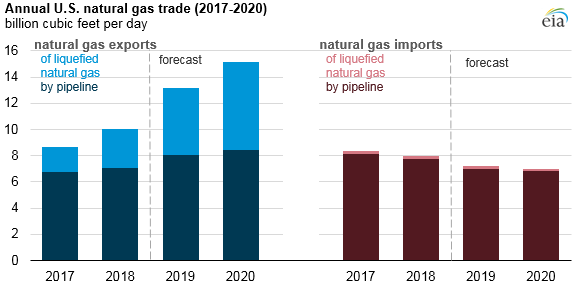
EIA anticipates that the United States will continue to export more natural gas than it imports during the coming years as production continues to outpace domestic consumption. Most of the increase in natural gas exports will come from additional liquefied natural gas (LNG) capacity additions at the Cameron LNG and Freeport LNG facilities located along the Gulf Coast, and the Elba Island LNG facility in Georgia.
EIA expects LNG exports to increase from an estimated 3.0 Bcf/d in 2018 to 5.1 Bcf/d this year and up to 6.8 Bcf/d next year, more than double 2018 levels.
Gross exports of natural gas by pipeline will continue to grow, according to EIA, increasing to 8.1 Bcf/d this year and 8.4 Bcf/d next year, or 19 percent higher than 2018 levels.
Most of the increase will be driven by increasing natural gas demand and pipeline projects in Mexico that are scheduled to come online by the end of 2020. Imports of LNG are expected to remain flat through 2020, and decreases in imports by pipeline will continue as Appalachian production and takeaway capacity displace Canadian natural gas in the U.S. Midwest markets.
(from the U.S. Energy Information Administration)

