Freight shipments climbing with a sequential uptick in trucking shipments during the 2Q

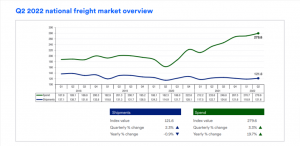
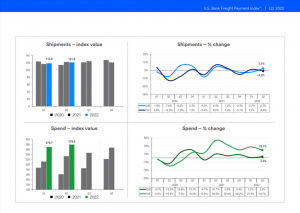
US Bank Q2 2022 National Freight Market Overview – A national trucking index published by U.S. Bank showed volumes were up 2.3% from the first quarter with spending up 3.3%.
Freight payments data released in late July showed a sequential uptick in trucking shipments during the second quarter, reversing the declining trend seen in the prior two quarters. Freight spending advanced again in the period as elevated fuel costs continue to push up all-in rates.
National shipments and spending — quarter over quarter, year over year

US Bank National Shipments And Spending – On a year-over-year comparison, truck freight was down 0.9% in the second quarter, according to U.S. Bank data, but spending surged 19.7%.
A national trucking index published by U.S. Bank showed volumes were up 2.3% from the first quarter with spending up 3.3%. Shipments in the quarter were slightly higher than the historical average “as contract freight outperformed the traditional spot market,” the report said. As the spot market has loosened and rates have fallen, routing guide compliance among carriers has stepped higher, resulting in the index’s advance.
“The economy contracted in the first quarter of 2022, which allowed shippers to pull freight out of the spot market,” the report continued. “This resulted in significant drops in spot market prices and volumes. More freight was moved back to their contract carriers.”
Data provided by American Trucking Associations (ATA) also showed that truck freight continues to be robust for carriers hauling under contracts. The group’s seasonally-adjusted, for-hire tonnage index increased by 2.7% from May to June. The index was 7.9% higher than June of 2021, which was the largest year-over-year increase recorded in the past four years. The data set is mostly derived from contract freight.
Enjoying our insights?
Subscribe to our newsletter to keep up with the latest industry trends and developments.
Stay InformedOn a year-over-year comparison, truck freight was down 0.9% in the second quarter, according to U.S. Bank data, but spending surged 19.7%. However, this was the smallest year-over-year increase in freight spend recorded since the first quarter of 2021.
The data showed contract pricing held up in the period with the spot market seeing a material step lower. Also, a notable spike in diesel fuel prices, 70% higher year over year on average during the quarter, was a big reason for the jump in the cost data set.
“Household consumption of goods decelerated or even contracted slightly, housing starts decreased with higher home prices and mortgage rates, but factory output held strong,” the report said.
Regional shipments and spending — quarter over quarter, year over year

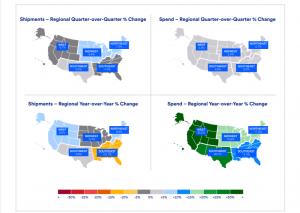
US Bank Regional Shipments And Spending – The Northeast saw the biggest jump in shipments, up 7.3% from the first quarter and 8.8% above the year-ago level. The Midwest saw the second-largest jump, 6.8% higher sequentially but 0.3% lower year-over-year.
The Northeast saw the biggest jump in shipments, up 7.3% from the first quarter and 8.8% above the year-ago level. The Midwest saw the second-largest jump, 6.8% higher sequentially but 0.3% lower year-over-year. The report credited “solid manufacturing output” as the driver of the relative out-performance in these regions.
Freight spend was the highest in the Southwest and West, advancing 4.8% and 4.3%, respectively, from the first quarter. Both regions also saw the highest year-over-year growth at roughly 30% in the quarter. The West also saw the largest one year increase in shipments at 9%, but those volumes were still 0.7% lower than the first quarter.
“While we’ve seen bigger jumps in spending in other quarters over the past year, the second-quarter increases were significant,” said Bobby Holland, vice president and director of Freight Data Solutions at U.S. Bank. “Contract carriers seemed to hold their prices relatively steady, but high levels of fuel surcharges likely drove up spending.”
About the index
The U.S. Bank Freight Payment Index is a quarterly publication representing freight shipping volumes and spend on national and regional levels. The U.S. Bank Freight Payment Index source data is based on the actual transaction payment date, contains our highest-volume domestic freight modes of truckload and less-than-truckload, and is both seasonally and calendar adjusted. The frst-quarter 2010 base point is 100. The chain-based index point for each subsequent quarter represents that quarter’s volume in relation to the immediately preceding quarter.
For more than 20 years, organizations have turned to U.S. Bank Freight Payment for the service, reliability and security that only a bank can provide. The pioneer in electronic freight payment, U.S. Bank Freight Payment processes more than $37 billion in freight payments annually for our corporate and federal government clients. Through a comprehensive online solution, organizations can streamline and automate their freight audit and payment processes and obtain the business intelligence needed to maintain a competitive supply chain.


