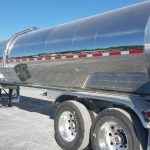
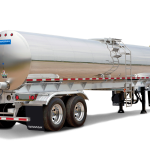
Featured photo: Milk-hauling trucks in Centerport, Pennsylvania. Illustrative file photo. (Photo: Shuvaev/Wikimedia Commons, CC BY-SA 4.0; cropped)
- USDA reported Western milk haulers losing money as contracted rates fell short of hauling costs in late September.
- An October 1 update flags rising hauling rates, without establishing whether those increases restore carrier margins.
- Fuel recovery, receiving arrangements and the full cost of each route determine whether additional milk movements pay.

A milk tanker at Wanner’s Farm in Narvon, Pennsylvania, on October 4, 2014. (Photo: Beyond My Ken/Wikimedia Commons, CC BY-SA 4.0)
Milk hauling costs exceeded contracted rates for Western haulers cited in USDA’s September 21–25 market report, bringing a specific transportation problem into the region’s dairy outlook. The finding shifts attention from milk availability to the financial terms under which tank fleets move it.
USDA’s Dairy Market News report for September 21–25 noted rising transportation expenses and carrier losses. Its October 1 Western update says increasing hauling rates are creating challenges for market participants. Neither report quantifies the gap between carrier revenue and expenses.


For dairy fleets, cooperatives and processors, the operating question is whether compensation follows the work actually performed: farm pickups, loaded and empty mileage, time at receiving plants, and the equipment needed to maintain service. A higher hauling rate can help, but its adequacy depends on the route and the costs it must cover.
A regional warning amid changing milk flows
The September report described a divided Western market. Unplanned downtime at California plants loosened milk availability, while processors in the Pacific Northwest and Mountain States found little spot milk to purchase.
By October 1, USDA described California spot availability as balanced, with some loads moving to neighboring states. Arizona remained tight and was bringing in spot milk and condensed skim. Pacific Northwest output was balanced with processing capacity, while some spot milk was available in Idaho.
That changing geography matters more to dispatch than a single national production figure. USDA’s September 22 Milk Production report put August U.S. output at 19.9 billion pounds, up 1.7% from a year earlier. California production fell 0.7%, and Arizona fell 3.1%, while Idaho increased 1.6%.
Monthly farm production and weekly spot availability measure different things. More milk nationally does not establish that a particular receiving plant has the supply it needs, or that a nearby tanker can complete another profitable movement. Processing schedules and destinations remain essential parts of the transportation calculation.
The loss reports also have limits. USDA identifies no affected carrier, contract rate, loss amount, or share of Western hauling capacity. The evidence supports a regional warning about inadequate recovery, not a conclusion that every Western fleet—or the national milk-hauling industry—is operating below cost.
Diesel relief varies across the West.
The latest U.S. Energy Information Administration diesel readings, for September 28, show why fuel exposure needs a regional check. The national average eased, but Rocky Mountain diesel increased from the preceding week.
| Market | Dollars per gallon | Weekly change |
|---|---|---|
| United States | $6.382 | −$0.147 |
| Rocky Mountain | $6.407 | +$0.067 |
| West Coast excluding California | $6.643 | −$0.148 |
| California | $8.181 | −$0.065 |
California’s benchmark remained nearly $1.80 above the national average. That difference does not measure any fleet’s surcharge shortfall: bulk purchasing, discounts, fueling locations, and contract terms can change the comparison. It does show why a national index alone cannot describe every Western operation’s fuel bill.
EIA publishes price benchmarks; it does not set or regulate fuel surcharges. Those arrangements are privately negotiated. A contract review therefore needs to establish the index, adjustment frequency, fuel-efficiency assumption, and movements eligible for recovery.
Timing is also an issue. A weekly adjustment may eventually compensate for more expensive fuel while leaving the carrier paying suppliers before collecting from its customer. Tank Transport’s analysis of fuel recovery and payment timing explains that distinction. Margin recovery and the cash needed to continue service deserve separate checks.
The full tanker cycle determines milk hauling costs

Milk-hauling equipment at Darigold’s dairy in Issaquah, Washington, on June 8, 2009. (Photo: Joe Mabel, “Issaquah, WA – Darigold 03”, CC BY-SA 3.0)
Milk hauling combines distance with a service schedule. A rate that covers an established farm-to-plant route may become inadequate if the delivery destination changes, the truck returns farther empty, or receiving takes longer. These are operating mechanisms to examine, not quantified causes assigned to the unnamed haulers in USDA’s report.
A simple illustration shows the sensitivity. Assume a tanker movement carries 50,000 pounds—500 hundredweight—and requires 400 total road miles, including its empty movement. At an assumed average of 6 mpg, road travel consumes about 66.7 gallons.
A $1-per-gallon fuel increase would add approximately $66.67 to that cycle, or 13.3 cents per hundredweight carried. If the same miles and assumed efficiency applied to a 40,000-pound load, the increase would be 16.7 cents per hundredweight. These are hypothetical calculations, not reported hauling rates, standard payloads, or measured carrier losses.
The comparison isolates fuel. It leaves out additional driver time, stationary fuel consumption, cleaning expenses, and maintenance and equipment costs. A fleet assessing a route needs its own records for those items and must identify which are already included in the agreed compensation.
Time can be equally consequential. If a longer receiving wait prevents a second movement, the effect extends beyond the hours billed on the first load. It can reduce the equipment’s revenue opportunities that day. Whether this occurs depends on actual schedules, driver availability, and the next assignment.
A higher hauling rate only restores a margin if it covers the work the tanker now performs.Tank Transport’s coverage of receiving changes and interstate milk rerouting in Vermont illustrates why the destination matters. That separate Northeast case does not establish the causes of Western losses; it shows the operational questions raised when an established delivery pattern changes.
A farmer’s deduction is not a carrier’s margin

A milk tanker at Cool Lawn dairy farm in Bealeton, Virginia, on August 12, 2025. (Photo: James Pinsky/USDA, public domain)
Milk-hauling figures require careful interpretation. In a September study, the Federal Order 30 Market Administrator examined May 2026 payroll records for 7,526 Upper Midwest dairy producers. Milk-volume-weighted hauling charges averaged $0.5260 per hundredweight, compared with $0.5087 a year earlier—an increase of about 3.4%.
Those are reported producer deductions in another region and an earlier month. They are not Western freight quotes, a measure of total carrier revenue, or the cost of operating a milk tanker. The study notes that hauling can be paid outside handler payroll, including through separate arrangements or producer-funded transportation.
University of Wisconsin–Madison Extension’s milk-hauling reference likewise distinguishes milk-check deductions from measured transportation costs. It explains that Federal Milk Marketing Orders do not regulate negotiated hauling charges and that plant sourcing distances reflect economics, milk density, competition, and supplier relationships.
For a contract discussion, keep four figures separate: what transportation costs the carrier, what the customer pays the carrier, what is deducted from the producer’s milk check, and what the producer receives for the milk. A change in one does not automatically establish an equivalent change in the others.
A practical review starts with a representative period of completed routes. Match revenue to total mileage and elapsed time, then identify diversions, extra stops, receiving waits, and cleaning movements. Comparing those records with the original service assumptions can distinguish a fuel-price problem from a route that has become more expensive for other reasons.
Any proposed adjustment should identify who pays, which movements qualify, and when it takes effect. The same clarity helps cooperatives and processors understand what service they are purchasing. Otherwise, a higher headline rate can coexist with an unresolved gap over empty mileage, waiting time, or an additional delivery leg.
Western Milk Hauling: Key Developments
- Losses were reported: USDA’s September 21–25 Western report identified hauling contracts that no longer covered costs.
- Rates are moving: The October 1 update flags increasing hauling rates, without measuring carrier margin recovery.
- Fuel exposure differs: Regional diesel prices and purchasing arrangements matter alongside the agreed surcharge formula.
- Accounting distinctions matter: Producer deductions cannot substitute for a carrier’s route-level revenue and expense records.
The next useful evidence is whether contract adjustments keep pace with actual service changes. Subsequent USDA reports can help track milk availability and transportation pressure, while Tank & Bulk Markets provides milk and dairy market data alongside regional diesel prices. For an individual operation, the decisive measure remains the margin on completed tanker cycles after accounting for full work and compensation.