Tank Transport · Liquid & Dry Bulk
Market Hub
Prices, production and freight indicators across liquid and dry bulk markets, with weather conditions and related reporting.
Market snapshot
Latest available observationsHistory & comparisons — U.S. On-Highway Diesel Seasonal chart available
2025-10-13 – 2026-10-19 · 54 observations
$/gal
Point to the chart, or focus it and use the left and right arrow keys, to inspect recorded values.
Available history only. Lines connect recorded observations; values between them are not supplied.
Recorded values
| Observation date | Value ($/gal) |
|---|---|
| 2025-10-13 | $3.665/gal |
| 2025-10-20 | $3.620/gal |
| 2025-10-27 | $3.718/gal |
| 2025-11-03 | $3.753/gal |
| 2025-11-10 | $3.837/gal |
| 2025-11-17 | $3.868/gal |
| 2025-11-24 | $3.831/gal |
| 2025-12-01 | $3.758/gal |
| 2025-12-08 | $3.665/gal |
| 2025-12-15 | $3.607/gal |
| 2025-12-22 | $3.544/gal |
| 2025-12-29 | $3.500/gal |
| 2026-01-05 | $3.477/gal |
| 2026-01-12 | $3.459/gal |
| 2026-01-19 | $3.530/gal |
| 2026-01-26 | $3.624/gal |
| 2026-02-02 | $3.681/gal |
| 2026-02-09 | $3.688/gal |
| 2026-02-16 | $3.711/gal |
| 2026-02-23 | $3.809/gal |
| 2026-03-02 | $3.897/gal |
| 2026-03-09 | $4.859/gal |
| 2026-03-16 | $5.071/gal |
| 2026-03-23 | $5.375/gal |
| 2026-03-30 | $5.401/gal |
| 2026-04-06 | $5.643/gal |
| 2026-04-13 | $5.608/gal |
| 2026-04-20 | $5.403/gal |
| 2026-04-27 | $5.351/gal |
| 2026-05-04 | $5.640/gal |
| 2026-05-11 | $5.639/gal |
| 2026-05-18 | $5.596/gal |
| 2026-05-25 | $5.523/gal |
| 2026-06-01 | $5.350/gal |
| 2026-06-08 | $5.210/gal |
| 2026-06-15 | $5.059/gal |
| 2026-06-22 | $4.832/gal |
| 2026-06-29 | $4.668/gal |
| 2026-07-06 | $4.578/gal |
| 2026-07-13 | $4.796/gal |
| 2026-07-20 | $5.134/gal |
| 2026-07-27 | $5.313/gal |
| 2026-08-03 | $5.348/gal |
| 2026-08-10 | $5.257/gal |
| 2026-08-17 | $5.454/gal |
| 2026-08-24 | $5.652/gal |
| 2026-08-31 | $5.599/gal |
| 2026-09-07 | $5.967/gal |
| 2026-09-14 | $6.285/gal |
| 2026-09-21 | $6.529/gal |
| 2026-09-28 | $6.382/gal |
| 2026-10-05 | $6.199/gal |
| 2026-10-12 | $6.179/gal |
| 2026-10-19 | $6.276/gal |
Latest observation comparisons
2026-10-19: $6.276/gal
52-week comparison
+$2.656/gal (+73.4%)
Compared with 2025-10-20: $3.620/gal.
Seasonal context
+$2.605/gal (+71.0%)
Compared with the same-season median of 5 available prior years: $3.671/gal.
Historical range: $3.553/gal to $5.339/gal.
Compare seasons — 2026 / 2025
Calendar-year comparison. 2026 data through 2026-10-19; later positions contain historical context only.
- 2026
- 2025
- Range of 3–5 prior years
$/gal
Point to the chart, or focus it and use the arrow keys, to compare a seasonal week. Home and End reach the first and last positions.
Weekly positions follow the latest observation’s weekday. Each year uses its nearest recorded observation within 3 days of that calendar date, within the same year. February 29 maps to February 28 in other years. Missing weeks break the lines and range; values are not filled in.
The shaded range uses the lowest and highest matched observations from the previous 5 calendar years, with at least 3 years at each position. Coverage can vary by week. This is historical context, not a forecast.
Seasonal dates & values
| Seasonal position | 2026 | 2025 | Historical range |
|---|---|---|---|
| 2026-01-05 | 2026-01-05: $3.477/gal | 2025-01-06: $3.561/gal | Low $2.640/gal (2021-01-04); high $4.583/gal (2023-01-02). 5 years: 2025, 2024, 2023, 2022, 2021. |
| 2026-01-12 | 2026-01-12: $3.459/gal | 2025-01-13: $3.602/gal | Low $2.670/gal (2021-01-11); high $4.549/gal (2023-01-09). 5 years: 2025, 2024, 2023, 2022, 2021. |
| 2026-01-19 | 2026-01-19: $3.530/gal | 2025-01-20: $3.715/gal | Low $2.696/gal (2021-01-18); high $4.524/gal (2023-01-16). 5 years: 2025, 2024, 2023, 2022, 2021. |
| 2026-01-26 | 2026-01-26: $3.624/gal | 2025-01-27: $3.659/gal | Low $2.716/gal (2021-01-25); high $4.604/gal (2023-01-23). 5 years: 2025, 2024, 2023, 2022, 2021. |
| 2026-02-02 | 2026-02-02: $3.681/gal | 2025-02-03: $3.660/gal | Low $2.738/gal (2021-02-01); high $4.622/gal (2023-01-30). 5 years: 2025, 2024, 2023, 2022, 2021. |
| 2026-02-09 | 2026-02-09: $3.688/gal | 2025-02-10: $3.665/gal | Low $2.801/gal (2021-02-08); high $4.539/gal (2023-02-06). 5 years: 2025, 2024, 2023, 2022, 2021. |
| 2026-02-16 | 2026-02-16: $3.711/gal | 2025-02-17: $3.677/gal | Low $2.876/gal (2021-02-15); high $4.444/gal (2023-02-13). 5 years: 2025, 2024, 2023, 2022, 2021. |
| 2026-02-23 | 2026-02-23: $3.809/gal | 2025-02-24: $3.697/gal | Low $2.973/gal (2021-02-22); high $4.376/gal (2023-02-20). 5 years: 2025, 2024, 2023, 2022, 2021. |
| 2026-03-02 | 2026-03-02: $3.897/gal | 2025-03-03: $3.635/gal | Low $3.072/gal (2021-03-01); high $4.294/gal (2023-02-27). 5 years: 2025, 2024, 2023, 2022, 2021. |
| 2026-03-09 | 2026-03-09: $4.859/gal | 2025-03-10: $3.582/gal | Low $3.143/gal (2021-03-08); high $4.849/gal (2022-03-07). 5 years: 2025, 2024, 2023, 2022, 2021. |
| 2026-03-16 | 2026-03-16: $5.071/gal | 2025-03-17: $3.549/gal | Low $3.191/gal (2021-03-15); high $5.250/gal (2022-03-14). 5 years: 2025, 2024, 2023, 2022, 2021. |
| 2026-03-23 | 2026-03-23: $5.375/gal | 2025-03-24: $3.567/gal | Low $3.194/gal (2021-03-22); high $5.134/gal (2022-03-21). 5 years: 2025, 2024, 2023, 2022, 2021. |
| 2026-03-30 | 2026-03-30: $5.401/gal | 2025-03-31: $3.592/gal | Low $3.161/gal (2021-03-29); high $5.185/gal (2022-03-28). 5 years: 2025, 2024, 2023, 2022, 2021. |
| 2026-04-06 | 2026-04-06: $5.643/gal | 2025-04-07: $3.639/gal | Low $3.144/gal (2021-04-05); high $5.144/gal (2022-04-04). 5 years: 2025, 2024, 2023, 2022, 2021. |
| 2026-04-13 | 2026-04-13: $5.608/gal | 2025-04-14: $3.579/gal | Low $3.129/gal (2021-04-12); high $5.073/gal (2022-04-11). 5 years: 2025, 2024, 2023, 2022, 2021. |
| 2026-04-20 | 2026-04-20: $5.403/gal | 2025-04-21: $3.534/gal | Low $3.124/gal (2021-04-19); high $5.101/gal (2022-04-18). 5 years: 2025, 2024, 2023, 2022, 2021. |
| 2026-04-27 | 2026-04-27: $5.351/gal | 2025-04-28: $3.514/gal | Low $3.124/gal (2021-04-26); high $5.160/gal (2022-04-25). 5 years: 2025, 2024, 2023, 2022, 2021. |
| 2026-05-04 | 2026-05-04: $5.640/gal | 2025-05-05: $3.497/gal | Low $3.142/gal (2021-05-03); high $5.509/gal (2022-05-02). 5 years: 2025, 2024, 2023, 2022, 2021. |
| 2026-05-11 | 2026-05-11: $5.639/gal | 2025-05-12: $3.476/gal | Low $3.186/gal (2021-05-10); high $5.623/gal (2022-05-09). 5 years: 2025, 2024, 2023, 2022, 2021. |
| 2026-05-18 | 2026-05-18: $5.596/gal | 2025-05-19: $3.536/gal | Low $3.249/gal (2021-05-17); high $5.613/gal (2022-05-16). 5 years: 2025, 2024, 2023, 2022, 2021. |
| 2026-05-25 | 2026-05-25: $5.523/gal | 2025-05-26: $3.487/gal | Low $3.253/gal (2021-05-24); high $5.571/gal (2022-05-23). 5 years: 2025, 2024, 2023, 2022, 2021. |
| 2026-06-01 | 2026-06-01: $5.350/gal | 2025-06-02: $3.451/gal | Low $3.255/gal (2021-05-31); high $5.539/gal (2022-05-30). 5 years: 2025, 2024, 2023, 2022, 2021. |
| 2026-06-08 | 2026-06-08: $5.210/gal | 2025-06-09: $3.471/gal | Low $3.274/gal (2021-06-07); high $5.703/gal (2022-06-06). 5 years: 2025, 2024, 2023, 2022, 2021. |
| 2026-06-15 | 2026-06-15: $5.059/gal | 2025-06-16: $3.571/gal | Low $3.286/gal (2021-06-14); high $5.718/gal (2022-06-13). 5 years: 2025, 2024, 2023, 2022, 2021. |
| 2026-06-22 | 2026-06-22: $4.832/gal | 2025-06-23: $3.775/gal | Low $3.287/gal (2021-06-21); high $5.810/gal (2022-06-20). 5 years: 2025, 2024, 2023, 2022, 2021. |
| 2026-06-29 | 2026-06-29: $4.668/gal | 2025-06-30: $3.727/gal | Low $3.300/gal (2021-06-28); high $5.783/gal (2022-06-27). 5 years: 2025, 2024, 2023, 2022, 2021. |
| 2026-07-06 | 2026-07-06: $4.578/gal | 2025-07-07: $3.739/gal | Low $3.331/gal (2021-07-05); high $5.675/gal (2022-07-04). 5 years: 2025, 2024, 2023, 2022, 2021. |
| 2026-07-13 | 2026-07-13: $4.796/gal | 2025-07-14: $3.758/gal | Low $3.338/gal (2021-07-12); high $5.568/gal (2022-07-11). 5 years: 2025, 2024, 2023, 2022, 2021. |
| 2026-07-20 | 2026-07-20: $5.134/gal | 2025-07-21: $3.812/gal | Low $3.344/gal (2021-07-19); high $5.432/gal (2022-07-18). 5 years: 2025, 2024, 2023, 2022, 2021. |
| 2026-07-27 | 2026-07-27: $5.313/gal | 2025-07-28: $3.805/gal | Low $3.342/gal (2021-07-26); high $5.268/gal (2022-07-25). 5 years: 2025, 2024, 2023, 2022, 2021. |
| 2026-08-03 | 2026-08-03: $5.348/gal | 2025-08-04: $3.800/gal | Low $3.367/gal (2021-08-02); high $5.138/gal (2022-08-01). 5 years: 2025, 2024, 2023, 2022, 2021. |
| 2026-08-10 | 2026-08-10: $5.257/gal | 2025-08-11: $3.754/gal | Low $3.364/gal (2021-08-09); high $4.993/gal (2022-08-08). 5 years: 2025, 2024, 2023, 2022, 2021. |
| 2026-08-17 | 2026-08-17: $5.454/gal | 2025-08-18: $3.713/gal | Low $3.356/gal (2021-08-16); high $4.911/gal (2022-08-15). 5 years: 2025, 2024, 2023, 2022, 2021. |
| 2026-08-24 | 2026-08-24: $5.652/gal | 2025-08-25: $3.708/gal | Low $3.324/gal (2021-08-23); high $4.909/gal (2022-08-22). 5 years: 2025, 2024, 2023, 2022, 2021. |
| 2026-08-31 | 2026-08-31: $5.599/gal | 2025-09-01: $3.734/gal | Low $3.339/gal (2021-08-30); high $5.115/gal (2022-08-29). 5 years: 2025, 2024, 2023, 2022, 2021. |
| 2026-09-07 | 2026-09-07: $5.967/gal | 2025-09-08: $3.766/gal | Low $3.373/gal (2021-09-06); high $5.084/gal (2022-09-05). 5 years: 2025, 2024, 2023, 2022, 2021. |
| 2026-09-14 | 2026-09-14: $6.285/gal | 2025-09-15: $3.739/gal | Low $3.372/gal (2021-09-13); high $5.033/gal (2022-09-12). 5 years: 2025, 2024, 2023, 2022, 2021. |
| 2026-09-21 | 2026-09-21: $6.529/gal | 2025-09-22: $3.749/gal | Low $3.385/gal (2021-09-20); high $4.964/gal (2022-09-19). 5 years: 2025, 2024, 2023, 2022, 2021. |
| 2026-09-28 | 2026-09-28: $6.382/gal | 2025-09-29: $3.754/gal | Low $3.406/gal (2021-09-27); high $4.889/gal (2022-09-26). 5 years: 2025, 2024, 2023, 2022, 2021. |
| 2026-10-05 | 2026-10-05: $6.199/gal | 2025-10-06: $3.711/gal | Low $3.477/gal (2021-10-04); high $4.836/gal (2022-10-03). 5 years: 2025, 2024, 2023, 2022, 2021. |
| 2026-10-12 | 2026-10-12: $6.179/gal | 2025-10-13: $3.665/gal | Low $3.586/gal (2021-10-11); high $5.224/gal (2022-10-10). 5 years: 2025, 2024, 2023, 2022, 2021. |
| 2026-10-19 | 2026-10-19: $6.276/gal | 2025-10-20: $3.620/gal | Low $3.553/gal (2024-10-21); high $5.339/gal (2022-10-17). 5 years: 2025, 2024, 2023, 2022, 2021. |
| 2026-10-26 | Unavailable | 2025-10-27: $3.718/gal | Low $3.573/gal (2024-10-28); high $5.341/gal (2022-10-24). 5 years: 2025, 2024, 2023, 2022, 2021. |
| 2026-11-02 | Unavailable | 2025-11-03: $3.753/gal | Low $3.536/gal (2024-11-04); high $5.317/gal (2022-10-31). 5 years: 2025, 2024, 2023, 2022, 2021. |
| 2026-11-09 | Unavailable | 2025-11-10: $3.837/gal | Low $3.521/gal (2024-11-11); high $5.333/gal (2022-11-07). 5 years: 2025, 2024, 2023, 2022, 2021. |
| 2026-11-16 | Unavailable | 2025-11-17: $3.868/gal | Low $3.491/gal (2024-11-18); high $5.313/gal (2022-11-14). 5 years: 2025, 2024, 2023, 2022, 2021. |
| 2026-11-23 | Unavailable | 2025-11-24: $3.831/gal | Low $3.539/gal (2024-11-25); high $5.233/gal (2022-11-21). 5 years: 2025, 2024, 2023, 2022, 2021. |
| 2026-11-30 | Unavailable | 2025-12-01: $3.758/gal | Low $3.540/gal (2024-12-02); high $5.141/gal (2022-11-28). 5 years: 2025, 2024, 2023, 2022, 2021. |
| 2026-12-07 | Unavailable | 2025-12-08: $3.665/gal | Low $3.458/gal (2024-12-09); high $4.967/gal (2022-12-05). 5 years: 2025, 2024, 2023, 2022, 2021. |
| 2026-12-14 | Unavailable | 2025-12-15: $3.607/gal | Low $3.494/gal (2024-12-16); high $4.754/gal (2022-12-12). 5 years: 2025, 2024, 2023, 2022, 2021. |
| 2026-12-21 | Unavailable | 2025-12-22: $3.544/gal | Low $3.476/gal (2024-12-23); high $4.596/gal (2022-12-19). 5 years: 2025, 2024, 2023, 2022, 2021. |
| 2026-12-28 | Unavailable | 2025-12-29: $3.500/gal | Low $3.500/gal (2025-12-29); high $4.537/gal (2022-12-26). 5 years: 2025, 2024, 2023, 2022, 2021. |
Comparison dates & method
Comparisons use the latest observation above and stay the same when you change the chart period. They use the provider values currently held in the local history, including available revisions.
The 52-week comparison uses an observation within 3 days of the date 364 days earlier. Actual comparison dates are shown above.
Seasonal context uses one observation within 3 days of the same calendar date in each of the previous 5 years, where available. At least 3 years are required. The displayed range describes those observations; it is not a forecast or a full-year high/low.
| Observation date | Value |
|---|---|
| 2025-10-20 | $3.620/gal |
| 2024-10-21 | $3.553/gal |
| 2023-10-16 | $4.444/gal |
| 2022-10-17 | $5.339/gal |
| 2021-10-18 | $3.671/gal |
History & comparisons — WTI Crude
2025-10-17 – 2026-10-20 · 252 observations
$/bbl
Point to the chart, or focus it and use the left and right arrow keys, to inspect recorded values.
Available history only. Lines connect recorded observations; values between them are not supplied.
Recorded values
| Observation date | Value ($/bbl) |
|---|---|
| 2025-10-17 | $58.30/bbl |
| 2025-10-20 | $58.34/bbl |
| 2025-10-21 | $58.66/bbl |
| 2025-10-22 | $59.30/bbl |
| 2025-10-23 | $62.44/bbl |
| 2025-10-24 | $62.27/bbl |
| 2025-10-27 | $62.13/bbl |
| 2025-10-28 | $60.97/bbl |
| 2025-10-29 | $61.26/bbl |
| 2025-10-30 | $61.36/bbl |
| 2025-10-31 | $61.75/bbl |
| 2025-11-03 | $61.79/bbl |
| 2025-11-04 | $61.38/bbl |
| 2025-11-05 | $60.40/bbl |
| 2025-11-06 | $60.24/bbl |
| 2025-11-07 | $60.54/bbl |
| 2025-11-10 | $60.94/bbl |
| 2025-11-12 | $59.30/bbl |
| 2025-11-13 | $59.54/bbl |
| 2025-11-14 | $60.87/bbl |
| 2025-11-17 | $60.66/bbl |
| 2025-11-18 | $61.51/bbl |
| 2025-11-19 | $60.27/bbl |
| 2025-11-20 | $60.07/bbl |
| 2025-11-21 | $58.86/bbl |
| 2025-11-24 | $59.11/bbl |
| 2025-11-25 | $58.25/bbl |
| 2025-11-26 | $58.81/bbl |
| 2025-11-28 | $58.58/bbl |
| 2025-12-01 | $59.47/bbl |
| 2025-12-02 | $58.81/bbl |
| 2025-12-03 | $59.09/bbl |
| 2025-12-04 | $59.82/bbl |
| 2025-12-05 | $60.23/bbl |
| 2025-12-08 | $59.04/bbl |
| 2025-12-09 | $58.40/bbl |
| 2025-12-10 | $58.67/bbl |
| 2025-12-11 | $57.76/bbl |
| 2025-12-12 | $57.61/bbl |
| 2025-12-15 | $56.97/bbl |
| 2025-12-16 | $55.44/bbl |
| 2025-12-17 | $56.07/bbl |
| 2025-12-18 | $56.22/bbl |
| 2025-12-19 | $56.80/bbl |
| 2025-12-22 | $58.18/bbl |
| 2025-12-23 | $58.55/bbl |
| 2025-12-24 | $58.72/bbl |
| 2025-12-26 | $56.60/bbl |
| 2025-12-29 | $57.89/bbl |
| 2025-12-30 | $57.79/bbl |
| 2025-12-31 | $57.26/bbl |
| 2026-01-02 | $57.21/bbl |
| 2026-01-05 | $58.10/bbl |
| 2026-01-06 | $56.97/bbl |
| 2026-01-07 | $56.01/bbl |
| 2026-01-08 | $57.74/bbl |
| 2026-01-09 | $58.96/bbl |
| 2026-01-12 | $59.39/bbl |
| 2026-01-13 | $60.85/bbl |
| 2026-01-14 | $61.84/bbl |
| 2026-01-15 | $59.13/bbl |
| 2026-01-16 | $59.40/bbl |
| 2026-01-20 | $60.30/bbl |
| 2026-01-21 | $60.38/bbl |
| 2026-01-22 | $59.24/bbl |
| 2026-01-23 | $60.70/bbl |
| 2026-01-26 | $60.46/bbl |
| 2026-01-27 | $62.04/bbl |
| 2026-01-28 | $62.75/bbl |
| 2026-01-29 | $64.77/bbl |
| 2026-01-30 | $64.50/bbl |
| 2026-02-02 | $61.60/bbl |
| 2026-02-03 | $62.62/bbl |
| 2026-02-04 | $64.56/bbl |
| 2026-02-05 | $62.90/bbl |
| 2026-02-06 | $63.77/bbl |
| 2026-02-09 | $64.53/bbl |
| 2026-02-10 | $64.20/bbl |
| 2026-02-11 | $64.80/bbl |
| 2026-02-12 | $63.08/bbl |
| 2026-02-13 | $63.05/bbl |
| 2026-02-17 | $62.53/bbl |
| 2026-02-18 | $65.33/bbl |
| 2026-02-19 | $66.66/bbl |
| 2026-02-20 | $66.69/bbl |
| 2026-02-23 | $66.36/bbl |
| 2026-02-24 | $65.62/bbl |
| 2026-02-25 | $65.30/bbl |
| 2026-02-26 | $65.10/bbl |
| 2026-02-27 | $66.96/bbl |
| 2026-03-02 | $71.13/bbl |
| 2026-03-03 | $74.48/bbl |
| 2026-03-04 | $74.58/bbl |
| 2026-03-05 | $80.88/bbl |
| 2026-03-06 | $90.77/bbl |
| 2026-03-09 | $94.65/bbl |
| 2026-03-10 | $83.71/bbl |
| 2026-03-11 | $86.80/bbl |
| 2026-03-12 | $95.61/bbl |
| 2026-03-13 | $98.48/bbl |
| 2026-03-16 | $93.39/bbl |
| 2026-03-17 | $96.01/bbl |
| 2026-03-18 | $96.12/bbl |
| 2026-03-19 | $96.11/bbl |
| 2026-03-20 | $98.71/bbl |
| 2026-03-23 | $89.33/bbl |
| 2026-03-24 | $93.18/bbl |
| 2026-03-25 | $91.51/bbl |
| 2026-03-26 | $96.18/bbl |
| 2026-03-27 | $101.26/bbl |
| 2026-03-30 | $104.69/bbl |
| 2026-03-31 | $102.86/bbl |
| 2026-04-01 | $101.90/bbl |
| 2026-04-02 | $113.23/bbl |
| 2026-04-06 | $114.01/bbl |
| 2026-04-07 | $114.58/bbl |
| 2026-04-08 | $96.17/bbl |
| 2026-04-09 | $99.62/bbl |
| 2026-04-10 | $98.34/bbl |
| 2026-04-13 | $100.72/bbl |
| 2026-04-14 | $93.07/bbl |
| 2026-04-15 | $93.04/bbl |
| 2026-04-16 | $96.46/bbl |
| 2026-04-17 | $85.91/bbl |
| 2026-04-20 | $91.06/bbl |
| 2026-04-21 | $93.64/bbl |
| 2026-04-22 | $94.76/bbl |
| 2026-04-23 | $99.27/bbl |
| 2026-04-24 | $98.42/bbl |
| 2026-04-27 | $99.89/bbl |
| 2026-04-28 | $103.45/bbl |
| 2026-04-29 | $110.47/bbl |
| 2026-04-30 | $108.64/bbl |
| 2026-05-01 | $105.38/bbl |
| 2026-05-04 | $109.76/bbl |
| 2026-05-05 | $105.66/bbl |
| 2026-05-06 | $98.75/bbl |
| 2026-05-07 | $98.38/bbl |
| 2026-05-08 | $98.87/bbl |
| 2026-05-11 | $101.56/bbl |
| 2026-05-12 | $105.78/bbl |
| 2026-05-13 | $104.52/bbl |
| 2026-05-14 | $104.66/bbl |
| 2026-05-15 | $108.99/bbl |
| 2026-05-18 | $112.25/bbl |
| 2026-05-19 | $112.09/bbl |
| 2026-05-20 | $101.69/bbl |
| 2026-05-21 | $100.20/bbl |
| 2026-05-22 | $100.35/bbl |
| 2026-05-26 | $97.63/bbl |
| 2026-05-27 | $92.35/bbl |
| 2026-05-28 | $92.65/bbl |
| 2026-05-29 | $91.16/bbl |
| 2026-06-01 | $95.96/bbl |
| 2026-06-02 | $97.47/bbl |
| 2026-06-03 | $99.76/bbl |
| 2026-06-04 | $96.83/bbl |
| 2026-06-05 | $94.32/bbl |
| 2026-06-08 | $95.00/bbl |
| 2026-06-09 | $91.90/bbl |
| 2026-06-10 | $93.68/bbl |
| 2026-06-11 | $91.58/bbl |
| 2026-06-12 | $88.62/bbl |
| 2026-06-15 | $84.65/bbl |
| 2026-06-16 | $79.80/bbl |
| 2026-06-17 | $80.65/bbl |
| 2026-06-18 | $80.35/bbl |
| 2026-06-22 | $78.94/bbl |
| 2026-06-23 | $74.62/bbl |
| 2026-06-24 | $71.42/bbl |
| 2026-06-25 | $72.67/bbl |
| 2026-06-26 | $70.30/bbl |
| 2026-06-29 | $71.87/bbl |
| 2026-06-30 | $70.56/bbl |
| 2026-07-01 | $69.74/bbl |
| 2026-07-02 | $69.73/bbl |
| 2026-07-06 | $69.60/bbl |
| 2026-07-07 | $71.53/bbl |
| 2026-07-08 | $74.56/bbl |
| 2026-07-09 | $73.15/bbl |
| 2026-07-10 | $72.45/bbl |
| 2026-07-13 | $79.20/bbl |
| 2026-07-14 | $80.44/bbl |
| 2026-07-15 | $80.73/bbl |
| 2026-07-16 | $80.03/bbl |
| 2026-07-17 | $83.43/bbl |
| 2026-07-20 | $84.38/bbl |
| 2026-07-21 | $86.04/bbl |
| 2026-07-22 | $87.66/bbl |
| 2026-07-23 | $93.08/bbl |
| 2026-07-24 | $91.74/bbl |
| 2026-07-27 | $84.25/bbl |
| 2026-07-28 | $80.91/bbl |
| 2026-07-29 | $86.08/bbl |
| 2026-07-30 | $85.15/bbl |
| 2026-07-31 | $86.16/bbl |
| 2026-08-03 | $81.96/bbl |
| 2026-08-04 | $77.33/bbl |
| 2026-08-05 | $76.78/bbl |
| 2026-08-06 | $78.88/bbl |
| 2026-08-07 | $79.77/bbl |
| 2026-08-10 | $83.76/bbl |
| 2026-08-11 | $84.77/bbl |
| 2026-08-12 | $84.97/bbl |
| 2026-08-13 | $82.77/bbl |
| 2026-08-14 | $83.99/bbl |
| 2026-08-17 | $86.04/bbl |
| 2026-08-18 | $86.48/bbl |
| 2026-08-19 | $87.28/bbl |
| 2026-08-20 | $89.75/bbl |
| 2026-08-21 | $87.21/bbl |
| 2026-08-24 | $86.34/bbl |
| 2026-08-25 | $83.90/bbl |
| 2026-08-26 | $83.46/bbl |
| 2026-08-27 | $84.81/bbl |
| 2026-08-28 | $84.57/bbl |
| 2026-08-31 | $87.03/bbl |
| 2026-09-01 | $91.48/bbl |
| 2026-09-02 | $92.15/bbl |
| 2026-09-03 | $92.55/bbl |
| 2026-09-04 | $92.69/bbl |
| 2026-09-08 | $94.21/bbl |
| 2026-09-09 | $97.26/bbl |
| 2026-09-10 | $103.57/bbl |
| 2026-09-11 | $101.27/bbl |
| 2026-09-14 | $102.42/bbl |
| 2026-09-15 | $107.02/bbl |
| 2026-09-16 | $103.62/bbl |
| 2026-09-17 | $103.21/bbl |
| 2026-09-18 | $101.44/bbl |
| 2026-09-21 | $96.97/bbl |
| 2026-09-22 | $96.41/bbl |
| 2026-09-23 | $93.38/bbl |
| 2026-09-24 | $95.88/bbl |
| 2026-09-25 | $85.23/bbl |
| 2026-09-28 | $99.37/bbl |
| 2026-09-29 | $96.16/bbl |
| 2026-09-30 | $97.18/bbl |
| 2026-10-01 | $99.77/bbl |
| 2026-10-02 | $97.89/bbl |
| 2026-10-05 | $96.13/bbl |
| 2026-10-06 | $96.24/bbl |
| 2026-10-07 | $95.02/bbl |
| 2026-10-08 | $98.26/bbl |
| 2026-10-09 | $98.73/bbl |
| 2026-10-12 | $94.99/bbl |
| 2026-10-13 | $95.39/bbl |
| 2026-10-14 | $96.34/bbl |
| 2026-10-15 | $104.71/bbl |
| 2026-10-16 | $108.21/bbl |
| 2026-10-19 | $110.01/bbl |
| 2026-10-20 | $107.89/bbl |
Latest observation comparisons
2026-10-20: $107.89/bbl
Year-over-year
+$49.55/bbl (+84.9%)
Compared with 2025-10-20: $58.34/bbl.
Comparison dates & method
Comparisons use the latest observation above and stay the same when you change the chart period. They use the provider values currently held in the local history, including available revisions.
The yearly comparison uses the calendar anniversary, or the closest earlier recorded day within 4 days. February 29 is compared with February 28 in a non-leap year.
History & comparisons — Basic Chemical Production
2025-08-01 – 2026-09-01 · 14 observations
index (2017=100)
Point to the chart, or focus it and use the left and right arrow keys, to inspect recorded values.
Available history only. Lines connect recorded observations; values between them are not supplied.
Recorded values
| Observation date | Value (index (2017=100)) |
|---|---|
| 2025-08-01 | 96.4 index (2017=100) |
| 2025-09-01 | 94.9 index (2017=100) |
| 2025-10-01 | 93.8 index (2017=100) |
| 2025-11-01 | 92.7 index (2017=100) |
| 2025-12-01 | 91.5 index (2017=100) |
| 2026-01-01 | 92.0 index (2017=100) |
| 2026-02-01 | 92.5 index (2017=100) |
| 2026-03-01 | 94.3 index (2017=100) |
| 2026-04-01 | 92.3 index (2017=100) |
| 2026-05-01 | 92.9 index (2017=100) |
| 2026-06-01 | 91.2 index (2017=100) |
| 2026-07-01 | 89.9 index (2017=100) |
| 2026-08-01 | 91.2 index (2017=100) |
| 2026-09-01 | 91.3 index (2017=100) |
Latest observation comparisons
2026-09-01: 91.3 index (2017=100)
Year-over-year
−3.6 index points (−3.8%)
Compared with 2025-09-01: 94.9 index (2017=100).
Comparison dates & method
Comparisons use the latest observation above and stay the same when you change the chart period. They use the provider values currently held in the local history, including available revisions.
The yearly comparison uses the same reporting month in the previous calendar year.
History & comparisons — Grain & Oilseed Milling Output
2025-08-01 – 2026-09-01 · 14 observations
index (2017=100)
Point to the chart, or focus it and use the left and right arrow keys, to inspect recorded values.
Available history only. Lines connect recorded observations; values between them are not supplied.
Recorded values
| Observation date | Value (index (2017=100)) |
|---|---|
| 2025-08-01 | 125.1 index (2017=100) |
| 2025-09-01 | 122.6 index (2017=100) |
| 2025-10-01 | 124.3 index (2017=100) |
| 2025-11-01 | 125.7 index (2017=100) |
| 2025-12-01 | 125.5 index (2017=100) |
| 2026-01-01 | 126.4 index (2017=100) |
| 2026-02-01 | 125.5 index (2017=100) |
| 2026-03-01 | 125.4 index (2017=100) |
| 2026-04-01 | 125.3 index (2017=100) |
| 2026-05-01 | 121.6 index (2017=100) |
| 2026-06-01 | 126.0 index (2017=100) |
| 2026-07-01 | 125.6 index (2017=100) |
| 2026-08-01 | 123.9 index (2017=100) |
| 2026-09-01 | 125.1 index (2017=100) |
Latest observation comparisons
2026-09-01: 125.1 index (2017=100)
Year-over-year
+2.5 index points (+2.0%)
Compared with 2025-09-01: 122.6 index (2017=100).
Comparison dates & method
Comparisons use the latest observation above and stay the same when you change the chart period. They use the provider values currently held in the local history, including available revisions.
The yearly comparison uses the same reporting month in the previous calendar year.
History & comparisons — U.S. Truck Tonnage Index
2025-06-01 – 2026-07-01 · 14 observations
index (2015=100)
Point to the chart, or focus it and use the left and right arrow keys, to inspect recorded values.
Available history only. Lines connect recorded observations; values between them are not supplied.
Recorded values
| Observation date | Value (index (2015=100)) |
|---|---|
| 2025-06-01 | 113.2 index (2015=100) |
| 2025-07-01 | 113.9 index (2015=100) |
| 2025-08-01 | 115.0 index (2015=100) |
| 2025-09-01 | 113.7 index (2015=100) |
| 2025-10-01 | 112.2 index (2015=100) |
| 2025-11-01 | 113.2 index (2015=100) |
| 2025-12-01 | 113.1 index (2015=100) |
| 2026-01-01 | 114.2 index (2015=100) |
| 2026-02-01 | 115.8 index (2015=100) |
| 2026-03-01 | 117.5 index (2015=100) |
| 2026-04-01 | 116.3 index (2015=100) |
| 2026-05-01 | 112.8 index (2015=100) |
| 2026-06-01 | 114.4 index (2015=100) |
| 2026-07-01 | 113.5 index (2015=100) |
Latest observation comparisons
2026-07-01: 113.5 index (2015=100)
Year-over-year
−0.4 index points (−0.4%)
Compared with 2025-07-01: 113.9 index (2015=100).
Comparison dates & method
Comparisons use the latest observation above and stay the same when you change the chart period. They use the provider values currently held in the local history, including available revisions.
The yearly comparison uses the same reporting month in the previous calendar year.
History & comparisons — Freight Transportation Services Index
2025-06-01 – 2026-07-01 · 14 observations
index (2000=100)
Point to the chart, or focus it and use the left and right arrow keys, to inspect recorded values.
Available history only. Lines connect recorded observations; values between them are not supplied.
Recorded values
| Observation date | Value (index (2000=100)) |
|---|---|
| 2025-06-01 | 137.0 index (2000=100) |
| 2025-07-01 | 138.5 index (2000=100) |
| 2025-08-01 | 138.9 index (2000=100) |
| 2025-09-01 | 138.0 index (2000=100) |
| 2025-10-01 | 136.7 index (2000=100) |
| 2025-11-01 | 137.2 index (2000=100) |
| 2025-12-01 | 136.9 index (2000=100) |
| 2026-01-01 | 136.3 index (2000=100) |
| 2026-02-01 | 138.4 index (2000=100) |
| 2026-03-01 | 139.3 index (2000=100) |
| 2026-04-01 | 138.2 index (2000=100) |
| 2026-05-01 | 135.3 index (2000=100) |
| 2026-06-01 | 136.6 index (2000=100) |
| 2026-07-01 | 135.7 index (2000=100) |
Latest observation comparisons
2026-07-01: 135.7 index (2000=100)
Year-over-year
−2.8 index points (−2.0%)
Compared with 2025-07-01: 138.5 index (2000=100).
Comparison dates & method
Comparisons use the latest observation above and stay the same when you change the chart period. They use the provider values currently held in the local history, including available revisions.
The yearly comparison uses the same reporting month in the previous calendar year.
Each card shows its reporting period. These indicators describe prices, production or broader freight activity; they do not measure tank-truck loads or bulk hauling rates.
How to read these indicators
Changes compare the latest figure with the previous available reporting period shown on each card.
Read each index against its named base year and units. Monthly observations describe that reporting month; they are not today’s prices. Different index levels cannot be compared as if they measured the same quantity.
SAAR means seasonally adjusted annual rate: an annualized spending pace, not the amount spent in one month. Source links explain the underlying series and revisions.
Notable changes
Henry Hub Natural Gas −5.49%
Daily · Oct 20, 2026 vs. Oct 19, 2026
Grain Barges: Mississippi Locks 27 +236.48%
Weekly · Oct 17, 2026 vs. Oct 10, 2026
U.S. Propane Producer Price Index +24.90%
Monthly · Sep 2026 vs. Aug 2026
Explore: Fuel & supplyFreightGrain movementWeatherRiversRoad conditions
About these changes
Up to one daily, weekly and monthly highlight is shown. Indicators outside the snapshot are considered first, with the largest percentage rise or fall selected from that group. A snapshot indicator may appear when no other comparable change is available.
Changes compare consecutive available observations with a positive previous value. Reporting dates and gaps differ between sources; these indicators do not all update daily. Percentages describe the size and direction of a change, not its importance or whether it is good or bad.
- Henry Hub Natural Gas: FRED (opens in a new tab)
- Grain Barges: Mississippi Locks 27: USDA (opens in a new tab)
- U.S. Propane Producer Price Index: FRED (opens in a new tab)
Regional diesel prices
Weekly retail · Dollars per gallonCompare U.S. on-highway diesel averages across the five EIA regions (PADDs). Retail prices include taxes; each card shows its reporting date.
History & comparisons — U.S. average — diesel Seasonal chart available
2025-10-13 – 2026-10-19 · 54 observations
$/gal
Point to the chart, or focus it and use the left and right arrow keys, to inspect recorded values.
Available history only. Lines connect recorded observations; values between them are not supplied.
Recorded values
| Observation date | Value ($/gal) |
|---|---|
| 2025-10-13 | $3.665/gal |
| 2025-10-20 | $3.620/gal |
| 2025-10-27 | $3.718/gal |
| 2025-11-03 | $3.753/gal |
| 2025-11-10 | $3.837/gal |
| 2025-11-17 | $3.868/gal |
| 2025-11-24 | $3.831/gal |
| 2025-12-01 | $3.758/gal |
| 2025-12-08 | $3.665/gal |
| 2025-12-15 | $3.607/gal |
| 2025-12-22 | $3.544/gal |
| 2025-12-29 | $3.500/gal |
| 2026-01-05 | $3.477/gal |
| 2026-01-12 | $3.459/gal |
| 2026-01-19 | $3.530/gal |
| 2026-01-26 | $3.624/gal |
| 2026-02-02 | $3.681/gal |
| 2026-02-09 | $3.688/gal |
| 2026-02-16 | $3.711/gal |
| 2026-02-23 | $3.809/gal |
| 2026-03-02 | $3.897/gal |
| 2026-03-09 | $4.859/gal |
| 2026-03-16 | $5.071/gal |
| 2026-03-23 | $5.375/gal |
| 2026-03-30 | $5.401/gal |
| 2026-04-06 | $5.643/gal |
| 2026-04-13 | $5.608/gal |
| 2026-04-20 | $5.403/gal |
| 2026-04-27 | $5.351/gal |
| 2026-05-04 | $5.640/gal |
| 2026-05-11 | $5.639/gal |
| 2026-05-18 | $5.596/gal |
| 2026-05-25 | $5.523/gal |
| 2026-06-01 | $5.350/gal |
| 2026-06-08 | $5.210/gal |
| 2026-06-15 | $5.059/gal |
| 2026-06-22 | $4.832/gal |
| 2026-06-29 | $4.668/gal |
| 2026-07-06 | $4.578/gal |
| 2026-07-13 | $4.796/gal |
| 2026-07-20 | $5.134/gal |
| 2026-07-27 | $5.313/gal |
| 2026-08-03 | $5.348/gal |
| 2026-08-10 | $5.257/gal |
| 2026-08-17 | $5.454/gal |
| 2026-08-24 | $5.652/gal |
| 2026-08-31 | $5.599/gal |
| 2026-09-07 | $5.967/gal |
| 2026-09-14 | $6.285/gal |
| 2026-09-21 | $6.529/gal |
| 2026-09-28 | $6.382/gal |
| 2026-10-05 | $6.199/gal |
| 2026-10-12 | $6.179/gal |
| 2026-10-19 | $6.276/gal |
Latest observation comparisons
2026-10-19: $6.276/gal
52-week comparison
+$2.656/gal (+73.4%)
Compared with 2025-10-20: $3.620/gal.
Seasonal context
+$2.605/gal (+71.0%)
Compared with the same-season median of 5 available prior years: $3.671/gal.
Historical range: $3.553/gal to $5.339/gal.
Compare seasons — 2026 / 2025
Calendar-year comparison. 2026 data through 2026-10-19; later positions contain historical context only.
- 2026
- 2025
- Range of 3–5 prior years
$/gal
Point to the chart, or focus it and use the arrow keys, to compare a seasonal week. Home and End reach the first and last positions.
Weekly positions follow the latest observation’s weekday. Each year uses its nearest recorded observation within 3 days of that calendar date, within the same year. February 29 maps to February 28 in other years. Missing weeks break the lines and range; values are not filled in.
The shaded range uses the lowest and highest matched observations from the previous 5 calendar years, with at least 3 years at each position. Coverage can vary by week. This is historical context, not a forecast.
Seasonal dates & values
| Seasonal position | 2026 | 2025 | Historical range |
|---|---|---|---|
| 2026-01-05 | 2026-01-05: $3.477/gal | 2025-01-06: $3.561/gal | Low $2.640/gal (2021-01-04); high $4.583/gal (2023-01-02). 5 years: 2025, 2024, 2023, 2022, 2021. |
| 2026-01-12 | 2026-01-12: $3.459/gal | 2025-01-13: $3.602/gal | Low $2.670/gal (2021-01-11); high $4.549/gal (2023-01-09). 5 years: 2025, 2024, 2023, 2022, 2021. |
| 2026-01-19 | 2026-01-19: $3.530/gal | 2025-01-20: $3.715/gal | Low $2.696/gal (2021-01-18); high $4.524/gal (2023-01-16). 5 years: 2025, 2024, 2023, 2022, 2021. |
| 2026-01-26 | 2026-01-26: $3.624/gal | 2025-01-27: $3.659/gal | Low $2.716/gal (2021-01-25); high $4.604/gal (2023-01-23). 5 years: 2025, 2024, 2023, 2022, 2021. |
| 2026-02-02 | 2026-02-02: $3.681/gal | 2025-02-03: $3.660/gal | Low $2.738/gal (2021-02-01); high $4.622/gal (2023-01-30). 5 years: 2025, 2024, 2023, 2022, 2021. |
| 2026-02-09 | 2026-02-09: $3.688/gal | 2025-02-10: $3.665/gal | Low $2.801/gal (2021-02-08); high $4.539/gal (2023-02-06). 5 years: 2025, 2024, 2023, 2022, 2021. |
| 2026-02-16 | 2026-02-16: $3.711/gal | 2025-02-17: $3.677/gal | Low $2.876/gal (2021-02-15); high $4.444/gal (2023-02-13). 5 years: 2025, 2024, 2023, 2022, 2021. |
| 2026-02-23 | 2026-02-23: $3.809/gal | 2025-02-24: $3.697/gal | Low $2.973/gal (2021-02-22); high $4.376/gal (2023-02-20). 5 years: 2025, 2024, 2023, 2022, 2021. |
| 2026-03-02 | 2026-03-02: $3.897/gal | 2025-03-03: $3.635/gal | Low $3.072/gal (2021-03-01); high $4.294/gal (2023-02-27). 5 years: 2025, 2024, 2023, 2022, 2021. |
| 2026-03-09 | 2026-03-09: $4.859/gal | 2025-03-10: $3.582/gal | Low $3.143/gal (2021-03-08); high $4.849/gal (2022-03-07). 5 years: 2025, 2024, 2023, 2022, 2021. |
| 2026-03-16 | 2026-03-16: $5.071/gal | 2025-03-17: $3.549/gal | Low $3.191/gal (2021-03-15); high $5.250/gal (2022-03-14). 5 years: 2025, 2024, 2023, 2022, 2021. |
| 2026-03-23 | 2026-03-23: $5.375/gal | 2025-03-24: $3.567/gal | Low $3.194/gal (2021-03-22); high $5.134/gal (2022-03-21). 5 years: 2025, 2024, 2023, 2022, 2021. |
| 2026-03-30 | 2026-03-30: $5.401/gal | 2025-03-31: $3.592/gal | Low $3.161/gal (2021-03-29); high $5.185/gal (2022-03-28). 5 years: 2025, 2024, 2023, 2022, 2021. |
| 2026-04-06 | 2026-04-06: $5.643/gal | 2025-04-07: $3.639/gal | Low $3.144/gal (2021-04-05); high $5.144/gal (2022-04-04). 5 years: 2025, 2024, 2023, 2022, 2021. |
| 2026-04-13 | 2026-04-13: $5.608/gal | 2025-04-14: $3.579/gal | Low $3.129/gal (2021-04-12); high $5.073/gal (2022-04-11). 5 years: 2025, 2024, 2023, 2022, 2021. |
| 2026-04-20 | 2026-04-20: $5.403/gal | 2025-04-21: $3.534/gal | Low $3.124/gal (2021-04-19); high $5.101/gal (2022-04-18). 5 years: 2025, 2024, 2023, 2022, 2021. |
| 2026-04-27 | 2026-04-27: $5.351/gal | 2025-04-28: $3.514/gal | Low $3.124/gal (2021-04-26); high $5.160/gal (2022-04-25). 5 years: 2025, 2024, 2023, 2022, 2021. |
| 2026-05-04 | 2026-05-04: $5.640/gal | 2025-05-05: $3.497/gal | Low $3.142/gal (2021-05-03); high $5.509/gal (2022-05-02). 5 years: 2025, 2024, 2023, 2022, 2021. |
| 2026-05-11 | 2026-05-11: $5.639/gal | 2025-05-12: $3.476/gal | Low $3.186/gal (2021-05-10); high $5.623/gal (2022-05-09). 5 years: 2025, 2024, 2023, 2022, 2021. |
| 2026-05-18 | 2026-05-18: $5.596/gal | 2025-05-19: $3.536/gal | Low $3.249/gal (2021-05-17); high $5.613/gal (2022-05-16). 5 years: 2025, 2024, 2023, 2022, 2021. |
| 2026-05-25 | 2026-05-25: $5.523/gal | 2025-05-26: $3.487/gal | Low $3.253/gal (2021-05-24); high $5.571/gal (2022-05-23). 5 years: 2025, 2024, 2023, 2022, 2021. |
| 2026-06-01 | 2026-06-01: $5.350/gal | 2025-06-02: $3.451/gal | Low $3.255/gal (2021-05-31); high $5.539/gal (2022-05-30). 5 years: 2025, 2024, 2023, 2022, 2021. |
| 2026-06-08 | 2026-06-08: $5.210/gal | 2025-06-09: $3.471/gal | Low $3.274/gal (2021-06-07); high $5.703/gal (2022-06-06). 5 years: 2025, 2024, 2023, 2022, 2021. |
| 2026-06-15 | 2026-06-15: $5.059/gal | 2025-06-16: $3.571/gal | Low $3.286/gal (2021-06-14); high $5.718/gal (2022-06-13). 5 years: 2025, 2024, 2023, 2022, 2021. |
| 2026-06-22 | 2026-06-22: $4.832/gal | 2025-06-23: $3.775/gal | Low $3.287/gal (2021-06-21); high $5.810/gal (2022-06-20). 5 years: 2025, 2024, 2023, 2022, 2021. |
| 2026-06-29 | 2026-06-29: $4.668/gal | 2025-06-30: $3.727/gal | Low $3.300/gal (2021-06-28); high $5.783/gal (2022-06-27). 5 years: 2025, 2024, 2023, 2022, 2021. |
| 2026-07-06 | 2026-07-06: $4.578/gal | 2025-07-07: $3.739/gal | Low $3.331/gal (2021-07-05); high $5.675/gal (2022-07-04). 5 years: 2025, 2024, 2023, 2022, 2021. |
| 2026-07-13 | 2026-07-13: $4.796/gal | 2025-07-14: $3.758/gal | Low $3.338/gal (2021-07-12); high $5.568/gal (2022-07-11). 5 years: 2025, 2024, 2023, 2022, 2021. |
| 2026-07-20 | 2026-07-20: $5.134/gal | 2025-07-21: $3.812/gal | Low $3.344/gal (2021-07-19); high $5.432/gal (2022-07-18). 5 years: 2025, 2024, 2023, 2022, 2021. |
| 2026-07-27 | 2026-07-27: $5.313/gal | 2025-07-28: $3.805/gal | Low $3.342/gal (2021-07-26); high $5.268/gal (2022-07-25). 5 years: 2025, 2024, 2023, 2022, 2021. |
| 2026-08-03 | 2026-08-03: $5.348/gal | 2025-08-04: $3.800/gal | Low $3.367/gal (2021-08-02); high $5.138/gal (2022-08-01). 5 years: 2025, 2024, 2023, 2022, 2021. |
| 2026-08-10 | 2026-08-10: $5.257/gal | 2025-08-11: $3.754/gal | Low $3.364/gal (2021-08-09); high $4.993/gal (2022-08-08). 5 years: 2025, 2024, 2023, 2022, 2021. |
| 2026-08-17 | 2026-08-17: $5.454/gal | 2025-08-18: $3.713/gal | Low $3.356/gal (2021-08-16); high $4.911/gal (2022-08-15). 5 years: 2025, 2024, 2023, 2022, 2021. |
| 2026-08-24 | 2026-08-24: $5.652/gal | 2025-08-25: $3.708/gal | Low $3.324/gal (2021-08-23); high $4.909/gal (2022-08-22). 5 years: 2025, 2024, 2023, 2022, 2021. |
| 2026-08-31 | 2026-08-31: $5.599/gal | 2025-09-01: $3.734/gal | Low $3.339/gal (2021-08-30); high $5.115/gal (2022-08-29). 5 years: 2025, 2024, 2023, 2022, 2021. |
| 2026-09-07 | 2026-09-07: $5.967/gal | 2025-09-08: $3.766/gal | Low $3.373/gal (2021-09-06); high $5.084/gal (2022-09-05). 5 years: 2025, 2024, 2023, 2022, 2021. |
| 2026-09-14 | 2026-09-14: $6.285/gal | 2025-09-15: $3.739/gal | Low $3.372/gal (2021-09-13); high $5.033/gal (2022-09-12). 5 years: 2025, 2024, 2023, 2022, 2021. |
| 2026-09-21 | 2026-09-21: $6.529/gal | 2025-09-22: $3.749/gal | Low $3.385/gal (2021-09-20); high $4.964/gal (2022-09-19). 5 years: 2025, 2024, 2023, 2022, 2021. |
| 2026-09-28 | 2026-09-28: $6.382/gal | 2025-09-29: $3.754/gal | Low $3.406/gal (2021-09-27); high $4.889/gal (2022-09-26). 5 years: 2025, 2024, 2023, 2022, 2021. |
| 2026-10-05 | 2026-10-05: $6.199/gal | 2025-10-06: $3.711/gal | Low $3.477/gal (2021-10-04); high $4.836/gal (2022-10-03). 5 years: 2025, 2024, 2023, 2022, 2021. |
| 2026-10-12 | 2026-10-12: $6.179/gal | 2025-10-13: $3.665/gal | Low $3.586/gal (2021-10-11); high $5.224/gal (2022-10-10). 5 years: 2025, 2024, 2023, 2022, 2021. |
| 2026-10-19 | 2026-10-19: $6.276/gal | 2025-10-20: $3.620/gal | Low $3.553/gal (2024-10-21); high $5.339/gal (2022-10-17). 5 years: 2025, 2024, 2023, 2022, 2021. |
| 2026-10-26 | Unavailable | 2025-10-27: $3.718/gal | Low $3.573/gal (2024-10-28); high $5.341/gal (2022-10-24). 5 years: 2025, 2024, 2023, 2022, 2021. |
| 2026-11-02 | Unavailable | 2025-11-03: $3.753/gal | Low $3.536/gal (2024-11-04); high $5.317/gal (2022-10-31). 5 years: 2025, 2024, 2023, 2022, 2021. |
| 2026-11-09 | Unavailable | 2025-11-10: $3.837/gal | Low $3.521/gal (2024-11-11); high $5.333/gal (2022-11-07). 5 years: 2025, 2024, 2023, 2022, 2021. |
| 2026-11-16 | Unavailable | 2025-11-17: $3.868/gal | Low $3.491/gal (2024-11-18); high $5.313/gal (2022-11-14). 5 years: 2025, 2024, 2023, 2022, 2021. |
| 2026-11-23 | Unavailable | 2025-11-24: $3.831/gal | Low $3.539/gal (2024-11-25); high $5.233/gal (2022-11-21). 5 years: 2025, 2024, 2023, 2022, 2021. |
| 2026-11-30 | Unavailable | 2025-12-01: $3.758/gal | Low $3.540/gal (2024-12-02); high $5.141/gal (2022-11-28). 5 years: 2025, 2024, 2023, 2022, 2021. |
| 2026-12-07 | Unavailable | 2025-12-08: $3.665/gal | Low $3.458/gal (2024-12-09); high $4.967/gal (2022-12-05). 5 years: 2025, 2024, 2023, 2022, 2021. |
| 2026-12-14 | Unavailable | 2025-12-15: $3.607/gal | Low $3.494/gal (2024-12-16); high $4.754/gal (2022-12-12). 5 years: 2025, 2024, 2023, 2022, 2021. |
| 2026-12-21 | Unavailable | 2025-12-22: $3.544/gal | Low $3.476/gal (2024-12-23); high $4.596/gal (2022-12-19). 5 years: 2025, 2024, 2023, 2022, 2021. |
| 2026-12-28 | Unavailable | 2025-12-29: $3.500/gal | Low $3.500/gal (2025-12-29); high $4.537/gal (2022-12-26). 5 years: 2025, 2024, 2023, 2022, 2021. |
Comparison dates & method
Comparisons use the latest observation above and stay the same when you change the chart period. They use the provider values currently held in the local history, including available revisions.
The 52-week comparison uses an observation within 3 days of the date 364 days earlier. Actual comparison dates are shown above.
Seasonal context uses one observation within 3 days of the same calendar date in each of the previous 5 years, where available. At least 3 years are required. The displayed range describes those observations; it is not a forecast or a full-year high/low.
| Observation date | Value |
|---|---|
| 2025-10-20 | $3.620/gal |
| 2024-10-21 | $3.553/gal |
| 2023-10-16 | $4.444/gal |
| 2022-10-17 | $5.339/gal |
| 2021-10-18 | $3.671/gal |
History & comparisons — East Coast — diesel Seasonal chart available
2025-10-13 – 2026-10-19 · 54 observations
$/gal
Point to the chart, or focus it and use the left and right arrow keys, to inspect recorded values.
Available history only. Lines connect recorded observations; values between them are not supplied.
Recorded values
| Observation date | Value ($/gal) |
|---|---|
| 2025-10-13 | $3.721/gal |
| 2025-10-20 | $3.675/gal |
| 2025-10-27 | $3.723/gal |
| 2025-11-03 | $3.754/gal |
| 2025-11-10 | $3.823/gal |
| 2025-11-17 | $3.856/gal |
| 2025-11-24 | $3.862/gal |
| 2025-12-01 | $3.785/gal |
| 2025-12-08 | $3.729/gal |
| 2025-12-15 | $3.703/gal |
| 2025-12-22 | $3.674/gal |
| 2025-12-29 | $3.645/gal |
| 2026-01-05 | $3.630/gal |
| 2026-01-12 | $3.613/gal |
| 2026-01-19 | $3.653/gal |
| 2026-01-26 | $3.694/gal |
| 2026-02-02 | $3.763/gal |
| 2026-02-09 | $3.756/gal |
| 2026-02-16 | $3.763/gal |
| 2026-02-23 | $3.843/gal |
| 2026-03-02 | $3.924/gal |
| 2026-03-09 | $4.901/gal |
| 2026-03-16 | $5.105/gal |
| 2026-03-23 | $5.480/gal |
| 2026-03-30 | $5.535/gal |
| 2026-04-06 | $5.740/gal |
| 2026-04-13 | $5.674/gal |
| 2026-04-20 | $5.494/gal |
| 2026-04-27 | $5.425/gal |
| 2026-05-04 | $5.504/gal |
| 2026-05-11 | $5.465/gal |
| 2026-05-18 | $5.420/gal |
| 2026-05-25 | $5.394/gal |
| 2026-06-01 | $5.237/gal |
| 2026-06-08 | $5.149/gal |
| 2026-06-15 | $5.048/gal |
| 2026-06-22 | $4.886/gal |
| 2026-06-29 | $4.758/gal |
| 2026-07-06 | $4.694/gal |
| 2026-07-13 | $4.894/gal |
| 2026-07-20 | $5.194/gal |
| 2026-07-27 | $5.354/gal |
| 2026-08-03 | $5.299/gal |
| 2026-08-10 | $5.193/gal |
| 2026-08-17 | $5.340/gal |
| 2026-08-24 | $5.498/gal |
| 2026-08-31 | $5.448/gal |
| 2026-09-07 | $5.744/gal |
| 2026-09-14 | $6.158/gal |
| 2026-09-21 | $6.268/gal |
| 2026-09-28 | $6.137/gal |
| 2026-10-05 | $5.951/gal |
| 2026-10-12 | $5.908/gal |
| 2026-10-19 | $5.984/gal |
Latest observation comparisons
2026-10-19: $5.984/gal
52-week comparison
+$2.309/gal (+62.8%)
Compared with 2025-10-20: $3.675/gal.
Seasonal context
+$2.309/gal (+62.8%)
Compared with the same-season median of 5 available prior years: $3.675/gal.
Historical range: $3.590/gal to $5.350/gal.
Compare seasons — 2026 / 2025
Calendar-year comparison. 2026 data through 2026-10-19; later positions contain historical context only.
- 2026
- 2025
- Range of 3–5 prior years
$/gal
Point to the chart, or focus it and use the arrow keys, to compare a seasonal week. Home and End reach the first and last positions.
Weekly positions follow the latest observation’s weekday. Each year uses its nearest recorded observation within 3 days of that calendar date, within the same year. February 29 maps to February 28 in other years. Missing weeks break the lines and range; values are not filled in.
The shaded range uses the lowest and highest matched observations from the previous 5 calendar years, with at least 3 years at each position. Coverage can vary by week. This is historical context, not a forecast.
Seasonal dates & values
| Seasonal position | 2026 | 2025 | Historical range |
|---|---|---|---|
| 2026-01-05 | 2026-01-05: $3.630/gal | 2025-01-06: $3.634/gal | Low $2.667/gal (2021-01-04); high $4.852/gal (2023-01-02). 5 years: 2025, 2024, 2023, 2022, 2021. |
| 2026-01-12 | 2026-01-12: $3.613/gal | 2025-01-13: $3.718/gal | Low $2.719/gal (2021-01-11); high $4.812/gal (2023-01-09). 5 years: 2025, 2024, 2023, 2022, 2021. |
| 2026-01-19 | 2026-01-19: $3.653/gal | 2025-01-20: $3.820/gal | Low $2.747/gal (2021-01-18); high $4.752/gal (2023-01-16). 5 years: 2025, 2024, 2023, 2022, 2021. |
| 2026-01-26 | 2026-01-26: $3.694/gal | 2025-01-27: $3.805/gal | Low $2.763/gal (2021-01-25); high $4.810/gal (2023-01-23). 5 years: 2025, 2024, 2023, 2022, 2021. |
| 2026-02-02 | 2026-02-02: $3.763/gal | 2025-02-03: $3.778/gal | Low $2.791/gal (2021-02-01); high $4.835/gal (2023-01-30). 5 years: 2025, 2024, 2023, 2022, 2021. |
| 2026-02-09 | 2026-02-09: $3.756/gal | 2025-02-10: $3.761/gal | Low $2.845/gal (2021-02-08); high $4.752/gal (2023-02-06). 5 years: 2025, 2024, 2023, 2022, 2021. |
| 2026-02-16 | 2026-02-16: $3.763/gal | 2025-02-17: $3.791/gal | Low $2.898/gal (2021-02-15); high $4.653/gal (2023-02-13). 5 years: 2025, 2024, 2023, 2022, 2021. |
| 2026-02-23 | 2026-02-23: $3.843/gal | 2025-02-24: $3.795/gal | Low $3.001/gal (2021-02-22); high $4.572/gal (2023-02-20). 5 years: 2025, 2024, 2023, 2022, 2021. |
| 2026-03-02 | 2026-03-02: $3.924/gal | 2025-03-03: $3.742/gal | Low $3.083/gal (2021-03-01); high $4.446/gal (2023-02-27). 5 years: 2025, 2024, 2023, 2022, 2021. |
| 2026-03-09 | 2026-03-09: $4.901/gal | 2025-03-10: $3.699/gal | Low $3.116/gal (2021-03-08); high $4.970/gal (2022-03-07). 5 years: 2025, 2024, 2023, 2022, 2021. |
| 2026-03-16 | 2026-03-16: $5.105/gal | 2025-03-17: $3.679/gal | Low $3.148/gal (2021-03-15); high $5.334/gal (2022-03-14). 5 years: 2025, 2024, 2023, 2022, 2021. |
| 2026-03-23 | 2026-03-23: $5.480/gal | 2025-03-24: $3.675/gal | Low $3.152/gal (2021-03-22); high $5.179/gal (2022-03-21). 5 years: 2025, 2024, 2023, 2022, 2021. |
| 2026-03-30 | 2026-03-30: $5.535/gal | 2025-03-31: $3.695/gal | Low $3.130/gal (2021-03-29); high $5.249/gal (2022-03-28). 5 years: 2025, 2024, 2023, 2022, 2021. |
| 2026-04-06 | 2026-04-06: $5.740/gal | 2025-04-07: $3.713/gal | Low $3.114/gal (2021-04-05); high $5.206/gal (2022-04-04). 5 years: 2025, 2024, 2023, 2022, 2021. |
| 2026-04-13 | 2026-04-13: $5.674/gal | 2025-04-14: $3.660/gal | Low $3.100/gal (2021-04-12); high $5.128/gal (2022-04-11). 5 years: 2025, 2024, 2023, 2022, 2021. |
| 2026-04-20 | 2026-04-20: $5.494/gal | 2025-04-21: $3.614/gal | Low $3.096/gal (2021-04-19); high $5.151/gal (2022-04-18). 5 years: 2025, 2024, 2023, 2022, 2021. |
| 2026-04-27 | 2026-04-27: $5.425/gal | 2025-04-28: $3.585/gal | Low $3.093/gal (2021-04-26); high $5.209/gal (2022-04-25). 5 years: 2025, 2024, 2023, 2022, 2021. |
| 2026-05-04 | 2026-05-04: $5.504/gal | 2025-05-05: $3.567/gal | Low $3.113/gal (2021-05-03); high $5.701/gal (2022-05-02). 5 years: 2025, 2024, 2023, 2022, 2021. |
| 2026-05-11 | 2026-05-11: $5.465/gal | 2025-05-12: $3.534/gal | Low $3.160/gal (2021-05-10); high $5.907/gal (2022-05-09). 5 years: 2025, 2024, 2023, 2022, 2021. |
| 2026-05-18 | 2026-05-18: $5.420/gal | 2025-05-19: $3.580/gal | Low $3.228/gal (2021-05-17); high $5.944/gal (2022-05-16). 5 years: 2025, 2024, 2023, 2022, 2021. |
| 2026-05-25 | 2026-05-25: $5.394/gal | 2025-05-26: $3.555/gal | Low $3.235/gal (2021-05-24); high $5.905/gal (2022-05-23). 5 years: 2025, 2024, 2023, 2022, 2021. |
| 2026-06-01 | 2026-06-01: $5.237/gal | 2025-06-02: $3.517/gal | Low $3.239/gal (2021-05-31); high $5.848/gal (2022-05-30). 5 years: 2025, 2024, 2023, 2022, 2021. |
| 2026-06-08 | 2026-06-08: $5.149/gal | 2025-06-09: $3.525/gal | Low $3.259/gal (2021-06-07); high $5.922/gal (2022-06-06). 5 years: 2025, 2024, 2023, 2022, 2021. |
| 2026-06-15 | 2026-06-15: $5.048/gal | 2025-06-16: $3.621/gal | Low $3.275/gal (2021-06-14); high $5.852/gal (2022-06-13). 5 years: 2025, 2024, 2023, 2022, 2021. |
| 2026-06-22 | 2026-06-22: $4.886/gal | 2025-06-23: $3.790/gal | Low $3.275/gal (2021-06-21); high $5.883/gal (2022-06-20). 5 years: 2025, 2024, 2023, 2022, 2021. |
| 2026-06-29 | 2026-06-29: $4.758/gal | 2025-06-30: $3.775/gal | Low $3.290/gal (2021-06-28); high $5.814/gal (2022-06-27). 5 years: 2025, 2024, 2023, 2022, 2021. |
| 2026-07-06 | 2026-07-06: $4.694/gal | 2025-07-07: $3.765/gal | Low $3.306/gal (2021-07-05); high $5.713/gal (2022-07-04). 5 years: 2025, 2024, 2023, 2022, 2021. |
| 2026-07-13 | 2026-07-13: $4.894/gal | 2025-07-14: $3.793/gal | Low $3.312/gal (2021-07-12); high $5.600/gal (2022-07-11). 5 years: 2025, 2024, 2023, 2022, 2021. |
| 2026-07-20 | 2026-07-20: $5.194/gal | 2025-07-21: $3.821/gal | Low $3.312/gal (2021-07-19); high $5.467/gal (2022-07-18). 5 years: 2025, 2024, 2023, 2022, 2021. |
| 2026-07-27 | 2026-07-27: $5.354/gal | 2025-07-28: $3.812/gal | Low $3.311/gal (2021-07-26); high $5.299/gal (2022-07-25). 5 years: 2025, 2024, 2023, 2022, 2021. |
| 2026-08-03 | 2026-08-03: $5.299/gal | 2025-08-04: $3.807/gal | Low $3.332/gal (2021-08-02); high $5.181/gal (2022-08-01). 5 years: 2025, 2024, 2023, 2022, 2021. |
| 2026-08-10 | 2026-08-10: $5.193/gal | 2025-08-11: $3.757/gal | Low $3.328/gal (2021-08-09); high $5.037/gal (2022-08-08). 5 years: 2025, 2024, 2023, 2022, 2021. |
| 2026-08-17 | 2026-08-17: $5.340/gal | 2025-08-18: $3.733/gal | Low $3.316/gal (2021-08-16); high $4.950/gal (2022-08-15). 5 years: 2025, 2024, 2023, 2022, 2021. |
| 2026-08-24 | 2026-08-24: $5.498/gal | 2025-08-25: $3.726/gal | Low $3.297/gal (2021-08-23); high $4.922/gal (2022-08-22). 5 years: 2025, 2024, 2023, 2022, 2021. |
| 2026-08-31 | 2026-08-31: $5.448/gal | 2025-09-01: $3.750/gal | Low $3.306/gal (2021-08-30); high $5.066/gal (2022-08-29). 5 years: 2025, 2024, 2023, 2022, 2021. |
| 2026-09-07 | 2026-09-07: $5.744/gal | 2025-09-08: $3.772/gal | Low $3.332/gal (2021-09-06); high $5.033/gal (2022-09-05). 5 years: 2025, 2024, 2023, 2022, 2021. |
| 2026-09-14 | 2026-09-14: $6.158/gal | 2025-09-15: $3.748/gal | Low $3.337/gal (2021-09-13); high $4.949/gal (2022-09-12). 5 years: 2025, 2024, 2023, 2022, 2021. |
| 2026-09-21 | 2026-09-21: $6.268/gal | 2025-09-22: $3.745/gal | Low $3.352/gal (2021-09-20); high $4.889/gal (2022-09-19). 5 years: 2025, 2024, 2023, 2022, 2021. |
| 2026-09-28 | 2026-09-28: $6.137/gal | 2025-09-29: $3.750/gal | Low $3.371/gal (2021-09-27); high $4.836/gal (2022-09-26). 5 years: 2025, 2024, 2023, 2022, 2021. |
| 2026-10-05 | 2026-10-05: $5.951/gal | 2025-10-06: $3.735/gal | Low $3.436/gal (2021-10-04); high $4.797/gal (2022-10-03). 5 years: 2025, 2024, 2023, 2022, 2021. |
| 2026-10-12 | 2026-10-12: $5.908/gal | 2025-10-13: $3.721/gal | Low $3.562/gal (2021-10-11); high $5.130/gal (2022-10-10). 5 years: 2025, 2024, 2023, 2022, 2021. |
| 2026-10-19 | 2026-10-19: $5.984/gal | 2025-10-20: $3.675/gal | Low $3.590/gal (2024-10-21); high $5.350/gal (2022-10-17). 5 years: 2025, 2024, 2023, 2022, 2021. |
| 2026-10-26 | Unavailable | 2025-10-27: $3.723/gal | Low $3.605/gal (2024-10-28); high $5.379/gal (2022-10-24). 5 years: 2025, 2024, 2023, 2022, 2021. |
| 2026-11-02 | Unavailable | 2025-11-03: $3.754/gal | Low $3.590/gal (2024-11-04); high $5.400/gal (2022-10-31). 5 years: 2025, 2024, 2023, 2022, 2021. |
| 2026-11-09 | Unavailable | 2025-11-10: $3.823/gal | Low $3.579/gal (2024-11-11); high $5.473/gal (2022-11-07). 5 years: 2025, 2024, 2023, 2022, 2021. |
| 2026-11-16 | Unavailable | 2025-11-17: $3.856/gal | Low $3.552/gal (2024-11-18); high $5.474/gal (2022-11-14). 5 years: 2025, 2024, 2023, 2022, 2021. |
| 2026-11-23 | Unavailable | 2025-11-24: $3.862/gal | Low $3.593/gal (2024-11-25); high $5.411/gal (2022-11-21). 5 years: 2025, 2024, 2023, 2022, 2021. |
| 2026-11-30 | Unavailable | 2025-12-01: $3.785/gal | Low $3.597/gal (2024-12-02); high $5.336/gal (2022-11-28). 5 years: 2025, 2024, 2023, 2022, 2021. |
| 2026-12-07 | Unavailable | 2025-12-08: $3.729/gal | Low $3.535/gal (2024-12-09); high $5.191/gal (2022-12-05). 5 years: 2025, 2024, 2023, 2022, 2021. |
| 2026-12-14 | Unavailable | 2025-12-15: $3.703/gal | Low $3.575/gal (2024-12-16); high $5.007/gal (2022-12-12). 5 years: 2025, 2024, 2023, 2022, 2021. |
| 2026-12-21 | Unavailable | 2025-12-22: $3.674/gal | Low $3.568/gal (2024-12-23); high $4.847/gal (2022-12-19). 5 years: 2025, 2024, 2023, 2022, 2021. |
| 2026-12-28 | Unavailable | 2025-12-29: $3.645/gal | Low $3.587/gal (2024-12-30); high $4.808/gal (2022-12-26). 5 years: 2025, 2024, 2023, 2022, 2021. |
Comparison dates & method
Comparisons use the latest observation above and stay the same when you change the chart period. They use the provider values currently held in the local history, including available revisions.
The 52-week comparison uses an observation within 3 days of the date 364 days earlier. Actual comparison dates are shown above.
Seasonal context uses one observation within 3 days of the same calendar date in each of the previous 5 years, where available. At least 3 years are required. The displayed range describes those observations; it is not a forecast or a full-year high/low.
| Observation date | Value |
|---|---|
| 2025-10-20 | $3.675/gal |
| 2024-10-21 | $3.590/gal |
| 2023-10-16 | $4.404/gal |
| 2022-10-17 | $5.350/gal |
| 2021-10-18 | $3.655/gal |
History & comparisons — Midwest — diesel Seasonal chart available
2025-10-13 – 2026-10-19 · 54 observations
$/gal
Point to the chart, or focus it and use the left and right arrow keys, to inspect recorded values.
Available history only. Lines connect recorded observations; values between them are not supplied.
Recorded values
| Observation date | Value ($/gal) |
|---|---|
| 2025-10-13 | $3.606/gal |
| 2025-10-20 | $3.564/gal |
| 2025-10-27 | $3.715/gal |
| 2025-11-03 | $3.773/gal |
| 2025-11-10 | $3.891/gal |
| 2025-11-17 | $3.913/gal |
| 2025-11-24 | $3.850/gal |
| 2025-12-01 | $3.755/gal |
| 2025-12-08 | $3.635/gal |
| 2025-12-15 | $3.567/gal |
| 2025-12-22 | $3.483/gal |
| 2025-12-29 | $3.424/gal |
| 2026-01-05 | $3.387/gal |
| 2026-01-12 | $3.365/gal |
| 2026-01-19 | $3.445/gal |
| 2026-01-26 | $3.579/gal |
| 2026-02-02 | $3.625/gal |
| 2026-02-09 | $3.636/gal |
| 2026-02-16 | $3.664/gal |
| 2026-02-23 | $3.798/gal |
| 2026-03-02 | $3.888/gal |
| 2026-03-09 | $4.801/gal |
| 2026-03-16 | $4.970/gal |
| 2026-03-23 | $5.160/gal |
| 2026-03-30 | $5.105/gal |
| 2026-04-06 | $5.304/gal |
| 2026-04-13 | $5.382/gal |
| 2026-04-20 | $5.165/gal |
| 2026-04-27 | $5.131/gal |
| 2026-05-04 | $5.742/gal |
| 2026-05-11 | $5.815/gal |
| 2026-05-18 | $5.749/gal |
| 2026-05-25 | $5.623/gal |
| 2026-06-01 | $5.392/gal |
| 2026-06-08 | $5.182/gal |
| 2026-06-15 | $5.011/gal |
| 2026-06-22 | $4.751/gal |
| 2026-06-29 | $4.583/gal |
| 2026-07-06 | $4.458/gal |
| 2026-07-13 | $4.659/gal |
| 2026-07-20 | $4.988/gal |
| 2026-07-27 | $5.196/gal |
| 2026-08-03 | $5.262/gal |
| 2026-08-10 | $5.181/gal |
| 2026-08-17 | $5.435/gal |
| 2026-08-24 | $5.636/gal |
| 2026-08-31 | $5.571/gal |
| 2026-09-07 | $5.946/gal |
| 2026-09-14 | $6.250/gal |
| 2026-09-21 | $6.680/gal |
| 2026-09-28 | $6.526/gal |
| 2026-10-05 | $6.286/gal |
| 2026-10-12 | $6.259/gal |
| 2026-10-19 | $6.352/gal |
Latest observation comparisons
2026-10-19: $6.352/gal
52-week comparison
+$2.788/gal (+78.2%)
Compared with 2025-10-20: $3.564/gal.
Seasonal context
+$2.737/gal (+75.7%)
Compared with the same-season median of 5 available prior years: $3.615/gal.
Historical range: $3.543/gal to $5.346/gal.
Compare seasons — 2026 / 2025
Calendar-year comparison. 2026 data through 2026-10-19; later positions contain historical context only.
- 2026
- 2025
- Range of 3–5 prior years
$/gal
Point to the chart, or focus it and use the arrow keys, to compare a seasonal week. Home and End reach the first and last positions.
Weekly positions follow the latest observation’s weekday. Each year uses its nearest recorded observation within 3 days of that calendar date, within the same year. February 29 maps to February 28 in other years. Missing weeks break the lines and range; values are not filled in.
The shaded range uses the lowest and highest matched observations from the previous 5 calendar years, with at least 3 years at each position. Coverage can vary by week. This is historical context, not a forecast.
Seasonal dates & values
| Seasonal position | 2026 | 2025 | Historical range |
|---|---|---|---|
| 2026-01-05 | 2026-01-05: $3.387/gal | 2025-01-06: $3.530/gal | Low $2.592/gal (2021-01-04); high $4.423/gal (2023-01-02). 5 years: 2025, 2024, 2023, 2022, 2021. |
| 2026-01-12 | 2026-01-12: $3.365/gal | 2025-01-13: $3.532/gal | Low $2.606/gal (2021-01-11); high $4.390/gal (2023-01-09). 5 years: 2025, 2024, 2023, 2022, 2021. |
| 2026-01-19 | 2026-01-19: $3.445/gal | 2025-01-20: $3.648/gal | Low $2.632/gal (2021-01-18); high $4.374/gal (2023-01-16). 5 years: 2025, 2024, 2023, 2022, 2021. |
| 2026-01-26 | 2026-01-26: $3.579/gal | 2025-01-27: $3.568/gal | Low $2.656/gal (2021-01-25); high $4.473/gal (2023-01-23). 5 years: 2025, 2024, 2023, 2022, 2021. |
| 2026-02-02 | 2026-02-02: $3.625/gal | 2025-02-03: $3.568/gal | Low $2.676/gal (2021-02-01); high $4.474/gal (2023-01-30). 5 years: 2025, 2024, 2023, 2022, 2021. |
| 2026-02-09 | 2026-02-09: $3.636/gal | 2025-02-10: $3.582/gal | Low $2.748/gal (2021-02-08); high $4.378/gal (2023-02-06). 5 years: 2025, 2024, 2023, 2022, 2021. |
| 2026-02-16 | 2026-02-16: $3.664/gal | 2025-02-17: $3.602/gal | Low $2.852/gal (2021-02-15); high $4.274/gal (2023-02-13). 5 years: 2025, 2024, 2023, 2022, 2021. |
| 2026-02-23 | 2026-02-23: $3.798/gal | 2025-02-24: $3.615/gal | Low $2.945/gal (2021-02-22); high $4.194/gal (2023-02-20). 5 years: 2025, 2024, 2023, 2022, 2021. |
| 2026-03-02 | 2026-03-02: $3.888/gal | 2025-03-03: $3.551/gal | Low $3.041/gal (2021-03-01); high $4.120/gal (2023-02-27). 5 years: 2025, 2024, 2023, 2022, 2021. |
| 2026-03-09 | 2026-03-09: $4.801/gal | 2025-03-10: $3.497/gal | Low $3.127/gal (2021-03-08); high $4.649/gal (2022-03-07). 5 years: 2025, 2024, 2023, 2022, 2021. |
| 2026-03-16 | 2026-03-16: $4.970/gal | 2025-03-17: $3.463/gal | Low $3.169/gal (2021-03-15); high $5.044/gal (2022-03-14). 5 years: 2025, 2024, 2023, 2022, 2021. |
| 2026-03-23 | 2026-03-23: $5.160/gal | 2025-03-24: $3.491/gal | Low $3.149/gal (2021-03-22); high $4.959/gal (2022-03-21). 5 years: 2025, 2024, 2023, 2022, 2021. |
| 2026-03-30 | 2026-03-30: $5.105/gal | 2025-03-31: $3.519/gal | Low $3.104/gal (2021-03-29); high $4.994/gal (2022-03-28). 5 years: 2025, 2024, 2023, 2022, 2021. |
| 2026-04-06 | 2026-04-06: $5.304/gal | 2025-04-07: $3.579/gal | Low $3.083/gal (2021-04-05); high $4.947/gal (2022-04-04). 5 years: 2025, 2024, 2023, 2022, 2021. |
| 2026-04-13 | 2026-04-13: $5.382/gal | 2025-04-14: $3.510/gal | Low $3.061/gal (2021-04-12); high $4.887/gal (2022-04-11). 5 years: 2025, 2024, 2023, 2022, 2021. |
| 2026-04-20 | 2026-04-20: $5.165/gal | 2025-04-21: $3.475/gal | Low $3.054/gal (2021-04-19); high $4.921/gal (2022-04-18). 5 years: 2025, 2024, 2023, 2022, 2021. |
| 2026-04-27 | 2026-04-27: $5.131/gal | 2025-04-28: $3.456/gal | Low $3.058/gal (2021-04-26); high $4.987/gal (2022-04-25). 5 years: 2025, 2024, 2023, 2022, 2021. |
| 2026-05-04 | 2026-05-04: $5.742/gal | 2025-05-05: $3.432/gal | Low $3.085/gal (2021-05-03); high $5.329/gal (2022-05-02). 5 years: 2025, 2024, 2023, 2022, 2021. |
| 2026-05-11 | 2026-05-11: $5.815/gal | 2025-05-12: $3.416/gal | Low $3.130/gal (2021-05-10); high $5.386/gal (2022-05-09). 5 years: 2025, 2024, 2023, 2022, 2021. |
| 2026-05-18 | 2026-05-18: $5.749/gal | 2025-05-19: $3.481/gal | Low $3.197/gal (2021-05-17); high $5.346/gal (2022-05-16). 5 years: 2025, 2024, 2023, 2022, 2021. |
| 2026-05-25 | 2026-05-25: $5.623/gal | 2025-05-26: $3.428/gal | Low $3.199/gal (2021-05-24); high $5.293/gal (2022-05-23). 5 years: 2025, 2024, 2023, 2022, 2021. |
| 2026-06-01 | 2026-06-01: $5.392/gal | 2025-06-02: $3.388/gal | Low $3.197/gal (2021-05-31); high $5.247/gal (2022-05-30). 5 years: 2025, 2024, 2023, 2022, 2021. |
| 2026-06-08 | 2026-06-08: $5.182/gal | 2025-06-09: $3.429/gal | Low $3.222/gal (2021-06-07); high $5.468/gal (2022-06-06). 5 years: 2025, 2024, 2023, 2022, 2021. |
| 2026-06-15 | 2026-06-15: $5.011/gal | 2025-06-16: $3.537/gal | Low $3.233/gal (2021-06-14); high $5.631/gal (2022-06-13). 5 years: 2025, 2024, 2023, 2022, 2021. |
| 2026-06-22 | 2026-06-22: $4.751/gal | 2025-06-23: $3.777/gal | Low $3.231/gal (2021-06-21); high $5.780/gal (2022-06-20). 5 years: 2025, 2024, 2023, 2022, 2021. |
| 2026-06-29 | 2026-06-29: $4.583/gal | 2025-06-30: $3.715/gal | Low $3.239/gal (2021-06-28); high $5.767/gal (2022-06-27). 5 years: 2025, 2024, 2023, 2022, 2021. |
| 2026-07-06 | 2026-07-06: $4.458/gal | 2025-07-07: $3.733/gal | Low $3.264/gal (2021-07-05); high $5.647/gal (2022-07-04). 5 years: 2025, 2024, 2023, 2022, 2021. |
| 2026-07-13 | 2026-07-13: $4.659/gal | 2025-07-14: $3.733/gal | Low $3.261/gal (2021-07-12); high $5.542/gal (2022-07-11). 5 years: 2025, 2024, 2023, 2022, 2021. |
| 2026-07-20 | 2026-07-20: $4.988/gal | 2025-07-21: $3.795/gal | Low $3.264/gal (2021-07-19); high $5.409/gal (2022-07-18). 5 years: 2025, 2024, 2023, 2022, 2021. |
| 2026-07-27 | 2026-07-27: $5.196/gal | 2025-07-28: $3.794/gal | Low $3.258/gal (2021-07-26); high $5.241/gal (2022-07-25). 5 years: 2025, 2024, 2023, 2022, 2021. |
| 2026-08-03 | 2026-08-03: $5.262/gal | 2025-08-04: $3.792/gal | Low $3.278/gal (2021-08-02); high $5.108/gal (2022-08-01). 5 years: 2025, 2024, 2023, 2022, 2021. |
| 2026-08-10 | 2026-08-10: $5.181/gal | 2025-08-11: $3.747/gal | Low $3.271/gal (2021-08-09); high $4.959/gal (2022-08-08). 5 years: 2025, 2024, 2023, 2022, 2021. |
| 2026-08-17 | 2026-08-17: $5.435/gal | 2025-08-18: $3.702/gal | Low $3.259/gal (2021-08-16); high $4.872/gal (2022-08-15). 5 years: 2025, 2024, 2023, 2022, 2021. |
| 2026-08-24 | 2026-08-24: $5.636/gal | 2025-08-25: $3.698/gal | Low $3.216/gal (2021-08-23); high $4.890/gal (2022-08-22). 5 years: 2025, 2024, 2023, 2022, 2021. |
| 2026-08-31 | 2026-08-31: $5.571/gal | 2025-09-01: $3.722/gal | Low $3.241/gal (2021-08-30); high $5.172/gal (2022-08-29). 5 years: 2025, 2024, 2023, 2022, 2021. |
| 2026-09-07 | 2026-09-07: $5.946/gal | 2025-09-08: $3.754/gal | Low $3.284/gal (2021-09-06); high $5.132/gal (2022-09-05). 5 years: 2025, 2024, 2023, 2022, 2021. |
| 2026-09-14 | 2026-09-14: $6.250/gal | 2025-09-15: $3.710/gal | Low $3.282/gal (2021-09-13); high $5.085/gal (2022-09-12). 5 years: 2025, 2024, 2023, 2022, 2021. |
| 2026-09-21 | 2026-09-21: $6.680/gal | 2025-09-22: $3.731/gal | Low $3.290/gal (2021-09-20); high $4.995/gal (2022-09-19). 5 years: 2025, 2024, 2023, 2022, 2021. |
| 2026-09-28 | 2026-09-28: $6.526/gal | 2025-09-29: $3.731/gal | Low $3.326/gal (2021-09-27); high $4.881/gal (2022-09-26). 5 years: 2025, 2024, 2023, 2022, 2021. |
| 2026-10-05 | 2026-10-05: $6.286/gal | 2025-10-06: $3.670/gal | Low $3.430/gal (2021-10-04); high $4.819/gal (2022-10-03). 5 years: 2025, 2024, 2023, 2022, 2021. |
| 2026-10-12 | 2026-10-12: $6.259/gal | 2025-10-13: $3.606/gal | Low $3.538/gal (2021-10-11); high $5.270/gal (2022-10-10). 5 years: 2025, 2024, 2023, 2022, 2021. |
| 2026-10-19 | 2026-10-19: $6.352/gal | 2025-10-20: $3.564/gal | Low $3.543/gal (2024-10-21); high $5.346/gal (2022-10-17). 5 years: 2025, 2024, 2023, 2022, 2021. |
| 2026-10-26 | Unavailable | 2025-10-27: $3.715/gal | Low $3.569/gal (2024-10-28); high $5.369/gal (2022-10-24). 5 years: 2025, 2024, 2023, 2022, 2021. |
| 2026-11-02 | Unavailable | 2025-11-03: $3.773/gal | Low $3.517/gal (2024-11-04); high $5.327/gal (2022-10-31). 5 years: 2025, 2024, 2023, 2022, 2021. |
| 2026-11-09 | Unavailable | 2025-11-10: $3.891/gal | Low $3.504/gal (2024-11-11); high $5.351/gal (2022-11-07). 5 years: 2025, 2024, 2023, 2022, 2021. |
| 2026-11-16 | Unavailable | 2025-11-17: $3.913/gal | Low $3.466/gal (2024-11-18); high $5.321/gal (2022-11-14). 5 years: 2025, 2024, 2023, 2022, 2021. |
| 2026-11-23 | Unavailable | 2025-11-24: $3.850/gal | Low $3.531/gal (2024-11-25); high $5.231/gal (2022-11-21). 5 years: 2025, 2024, 2023, 2022, 2021. |
| 2026-11-30 | Unavailable | 2025-12-01: $3.755/gal | Low $3.521/gal (2024-12-02); high $5.108/gal (2022-11-28). 5 years: 2025, 2024, 2023, 2022, 2021. |
| 2026-12-07 | Unavailable | 2025-12-08: $3.635/gal | Low $3.425/gal (2024-12-09); high $4.907/gal (2022-12-05). 5 years: 2025, 2024, 2023, 2022, 2021. |
| 2026-12-14 | Unavailable | 2025-12-15: $3.567/gal | Low $3.450/gal (2024-12-16); high $4.651/gal (2022-12-12). 5 years: 2025, 2024, 2023, 2022, 2021. |
| 2026-12-21 | Unavailable | 2025-12-22: $3.483/gal | Low $3.449/gal (2024-12-23); high $4.477/gal (2022-12-19). 5 years: 2025, 2024, 2023, 2022, 2021. |
| 2026-12-28 | Unavailable | 2025-12-29: $3.424/gal | Low $3.424/gal (2025-12-29); high $4.402/gal (2022-12-26). 5 years: 2025, 2024, 2023, 2022, 2021. |
Comparison dates & method
Comparisons use the latest observation above and stay the same when you change the chart period. They use the provider values currently held in the local history, including available revisions.
The 52-week comparison uses an observation within 3 days of the date 364 days earlier. Actual comparison dates are shown above.
Seasonal context uses one observation within 3 days of the same calendar date in each of the previous 5 years, where available. At least 3 years are required. The displayed range describes those observations; it is not a forecast or a full-year high/low.
| Observation date | Value |
|---|---|
| 2025-10-20 | $3.564/gal |
| 2024-10-21 | $3.543/gal |
| 2023-10-16 | $4.304/gal |
| 2022-10-17 | $5.346/gal |
| 2021-10-18 | $3.615/gal |
History & comparisons — Gulf Coast — diesel Seasonal chart available
2025-10-13 – 2026-10-19 · 54 observations
$/gal
Point to the chart, or focus it and use the left and right arrow keys, to inspect recorded values.
Available history only. Lines connect recorded observations; values between them are not supplied.
Recorded values
| Observation date | Value ($/gal) |
|---|---|
| 2025-10-13 | $3.299/gal |
| 2025-10-20 | $3.256/gal |
| 2025-10-27 | $3.350/gal |
| 2025-11-03 | $3.374/gal |
| 2025-11-10 | $3.436/gal |
| 2025-11-17 | $3.490/gal |
| 2025-11-24 | $3.459/gal |
| 2025-12-01 | $3.415/gal |
| 2025-12-08 | $3.327/gal |
| 2025-12-15 | $3.267/gal |
| 2025-12-22 | $3.214/gal |
| 2025-12-29 | $3.184/gal |
| 2026-01-05 | $3.172/gal |
| 2026-01-12 | $3.160/gal |
| 2026-01-19 | $3.248/gal |
| 2026-01-26 | $3.325/gal |
| 2026-02-02 | $3.379/gal |
| 2026-02-09 | $3.377/gal |
| 2026-02-16 | $3.412/gal |
| 2026-02-23 | $3.489/gal |
| 2026-03-02 | $3.598/gal |
| 2026-03-09 | $4.627/gal |
| 2026-03-16 | $4.835/gal |
| 2026-03-23 | $5.134/gal |
| 2026-03-30 | $5.105/gal |
| 2026-04-06 | $5.415/gal |
| 2026-04-13 | $5.310/gal |
| 2026-04-20 | $5.069/gal |
| 2026-04-27 | $5.012/gal |
| 2026-05-04 | $5.178/gal |
| 2026-05-11 | $5.152/gal |
| 2026-05-18 | $5.122/gal |
| 2026-05-25 | $5.045/gal |
| 2026-06-01 | $4.900/gal |
| 2026-06-08 | $4.786/gal |
| 2026-06-15 | $4.646/gal |
| 2026-06-22 | $4.415/gal |
| 2026-06-29 | $4.283/gal |
| 2026-07-06 | $4.225/gal |
| 2026-07-13 | $4.546/gal |
| 2026-07-20 | $4.942/gal |
| 2026-07-27 | $5.087/gal |
| 2026-08-03 | $5.141/gal |
| 2026-08-10 | $5.044/gal |
| 2026-08-17 | $5.237/gal |
| 2026-08-24 | $5.481/gal |
| 2026-08-31 | $5.360/gal |
| 2026-09-07 | $5.754/gal |
| 2026-09-14 | $6.027/gal |
| 2026-09-21 | $6.177/gal |
| 2026-09-28 | $5.955/gal |
| 2026-10-05 | $5.819/gal |
| 2026-10-12 | $5.809/gal |
| 2026-10-19 | $5.903/gal |
Latest observation comparisons
2026-10-19: $5.903/gal
52-week comparison
+$2.647/gal (+81.3%)
Compared with 2025-10-20: $3.256/gal.
Seasonal context
+$2.481/gal (+72.5%)
Compared with the same-season median of 5 available prior years: $3.422/gal.
Historical range: $3.199/gal to $5.018/gal.
Compare seasons — 2026 / 2025
Calendar-year comparison. 2026 data through 2026-10-19; later positions contain historical context only.
- 2026
- 2025
- Range of 3–5 prior years
$/gal
Point to the chart, or focus it and use the arrow keys, to compare a seasonal week. Home and End reach the first and last positions.
Weekly positions follow the latest observation’s weekday. Each year uses its nearest recorded observation within 3 days of that calendar date, within the same year. February 29 maps to February 28 in other years. Missing weeks break the lines and range; values are not filled in.
The shaded range uses the lowest and highest matched observations from the previous 5 calendar years, with at least 3 years at each position. Coverage can vary by week. This is historical context, not a forecast.
Seasonal dates & values
| Seasonal position | 2026 | 2025 | Historical range |
|---|---|---|---|
| 2026-01-05 | 2026-01-05: $3.172/gal | 2025-01-06: $3.269/gal | Low $2.398/gal (2021-01-04); high $4.267/gal (2023-01-02). 5 years: 2025, 2024, 2023, 2022, 2021. |
| 2026-01-12 | 2026-01-12: $3.160/gal | 2025-01-13: $3.321/gal | Low $2.429/gal (2021-01-11); high $4.223/gal (2023-01-09). 5 years: 2025, 2024, 2023, 2022, 2021. |
| 2026-01-19 | 2026-01-19: $3.248/gal | 2025-01-20: $3.455/gal | Low $2.461/gal (2021-01-18); high $4.224/gal (2023-01-16). 5 years: 2025, 2024, 2023, 2022, 2021. |
| 2026-01-26 | 2026-01-26: $3.325/gal | 2025-01-27: $3.378/gal | Low $2.483/gal (2021-01-25); high $4.320/gal (2023-01-23). 5 years: 2025, 2024, 2023, 2022, 2021. |
| 2026-02-02 | 2026-02-02: $3.379/gal | 2025-02-03: $3.395/gal | Low $2.500/gal (2021-02-01); high $4.351/gal (2023-01-30). 5 years: 2025, 2024, 2023, 2022, 2021. |
| 2026-02-09 | 2026-02-09: $3.377/gal | 2025-02-10: $3.393/gal | Low $2.566/gal (2021-02-08); high $4.249/gal (2023-02-06). 5 years: 2025, 2024, 2023, 2022, 2021. |
| 2026-02-16 | 2026-02-16: $3.412/gal | 2025-02-17: $3.382/gal | Low $2.627/gal (2021-02-15); high $4.150/gal (2023-02-13). 5 years: 2025, 2024, 2023, 2022, 2021. |
| 2026-02-23 | 2026-02-23: $3.489/gal | 2025-02-24: $3.420/gal | Low $2.722/gal (2021-02-22); high $4.100/gal (2023-02-20). 5 years: 2025, 2024, 2023, 2022, 2021. |
| 2026-03-02 | 2026-03-02: $3.598/gal | 2025-03-03: $3.343/gal | Low $2.837/gal (2021-03-01); high $4.027/gal (2023-02-27). 5 years: 2025, 2024, 2023, 2022, 2021. |
| 2026-03-09 | 2026-03-09: $4.627/gal | 2025-03-10: $3.284/gal | Low $2.929/gal (2021-03-08); high $4.703/gal (2022-03-07). 5 years: 2025, 2024, 2023, 2022, 2021. |
| 2026-03-16 | 2026-03-16: $4.835/gal | 2025-03-17: $3.245/gal | Low $2.988/gal (2021-03-15); high $5.110/gal (2022-03-14). 5 years: 2025, 2024, 2023, 2022, 2021. |
| 2026-03-23 | 2026-03-23: $5.134/gal | 2025-03-24: $3.265/gal | Low $2.991/gal (2021-03-22); high $4.964/gal (2022-03-21). 5 years: 2025, 2024, 2023, 2022, 2021. |
| 2026-03-30 | 2026-03-30: $5.105/gal | 2025-03-31: $3.282/gal | Low $2.955/gal (2021-03-29); high $4.972/gal (2022-03-28). 5 years: 2025, 2024, 2023, 2022, 2021. |
| 2026-04-06 | 2026-04-06: $5.415/gal | 2025-04-07: $3.338/gal | Low $2.934/gal (2021-04-05); high $4.929/gal (2022-04-04). 5 years: 2025, 2024, 2023, 2022, 2021. |
| 2026-04-13 | 2026-04-13: $5.310/gal | 2025-04-14: $3.267/gal | Low $2.924/gal (2021-04-12); high $4.840/gal (2022-04-11). 5 years: 2025, 2024, 2023, 2022, 2021. |
| 2026-04-20 | 2026-04-20: $5.069/gal | 2025-04-21: $3.195/gal | Low $2.923/gal (2021-04-19); high $4.855/gal (2022-04-18). 5 years: 2025, 2024, 2023, 2022, 2021. |
| 2026-04-27 | 2026-04-27: $5.012/gal | 2025-04-28: $3.183/gal | Low $2.917/gal (2021-04-26); high $4.916/gal (2022-04-25). 5 years: 2025, 2024, 2023, 2022, 2021. |
| 2026-05-04 | 2026-05-04: $5.178/gal | 2025-05-05: $3.174/gal | Low $2.924/gal (2021-05-03); high $5.210/gal (2022-05-02). 5 years: 2025, 2024, 2023, 2022, 2021. |
| 2026-05-11 | 2026-05-11: $5.152/gal | 2025-05-12: $3.143/gal | Low $2.968/gal (2021-05-10); high $5.339/gal (2022-05-09). 5 years: 2025, 2024, 2023, 2022, 2021. |
| 2026-05-18 | 2026-05-18: $5.122/gal | 2025-05-19: $3.201/gal | Low $3.029/gal (2021-05-17); high $5.295/gal (2022-05-16). 5 years: 2025, 2024, 2023, 2022, 2021. |
| 2026-05-25 | 2026-05-25: $5.045/gal | 2025-05-26: $3.136/gal | Low $3.029/gal (2021-05-24); high $5.216/gal (2022-05-23). 5 years: 2025, 2024, 2023, 2022, 2021. |
| 2026-06-01 | 2026-06-01: $4.900/gal | 2025-06-02: $3.097/gal | Low $3.027/gal (2021-05-31); high $5.180/gal (2022-05-30). 5 years: 2025, 2024, 2023, 2022, 2021. |
| 2026-06-08 | 2026-06-08: $4.786/gal | 2025-06-09: $3.109/gal | Low $3.034/gal (2021-06-07); high $5.309/gal (2022-06-06). 5 years: 2025, 2024, 2023, 2022, 2021. |
| 2026-06-15 | 2026-06-15: $4.646/gal | 2025-06-16: $3.212/gal | Low $3.040/gal (2021-06-14); high $5.370/gal (2022-06-13). 5 years: 2025, 2024, 2023, 2022, 2021. |
| 2026-06-22 | 2026-06-22: $4.415/gal | 2025-06-23: $3.436/gal | Low $3.042/gal (2021-06-21); high $5.453/gal (2022-06-20). 5 years: 2025, 2024, 2023, 2022, 2021. |
| 2026-06-29 | 2026-06-29: $4.283/gal | 2025-06-30: $3.369/gal | Low $3.044/gal (2021-06-28); high $5.441/gal (2022-06-27). 5 years: 2025, 2024, 2023, 2022, 2021. |
| 2026-07-06 | 2026-07-06: $4.225/gal | 2025-07-07: $3.383/gal | Low $3.076/gal (2021-07-05); high $5.330/gal (2022-07-04). 5 years: 2025, 2024, 2023, 2022, 2021. |
| 2026-07-13 | 2026-07-13: $4.546/gal | 2025-07-14: $3.403/gal | Low $3.083/gal (2021-07-12); high $5.217/gal (2022-07-11). 5 years: 2025, 2024, 2023, 2022, 2021. |
| 2026-07-20 | 2026-07-20: $4.942/gal | 2025-07-21: $3.476/gal | Low $3.083/gal (2021-07-19); high $5.083/gal (2022-07-18). 5 years: 2025, 2024, 2023, 2022, 2021. |
| 2026-07-27 | 2026-07-27: $5.087/gal | 2025-07-28: $3.454/gal | Low $3.079/gal (2021-07-26); high $4.911/gal (2022-07-25). 5 years: 2025, 2024, 2023, 2022, 2021. |
| 2026-08-03 | 2026-08-03: $5.141/gal | 2025-08-04: $3.442/gal | Low $3.097/gal (2021-08-02); high $4.801/gal (2022-08-01). 5 years: 2025, 2024, 2023, 2022, 2021. |
| 2026-08-10 | 2026-08-10: $5.044/gal | 2025-08-11: $3.397/gal | Low $3.083/gal (2021-08-09); high $4.677/gal (2022-08-08). 5 years: 2025, 2024, 2023, 2022, 2021. |
| 2026-08-17 | 2026-08-17: $5.237/gal | 2025-08-18: $3.340/gal | Low $3.073/gal (2021-08-16); high $4.614/gal (2022-08-15). 5 years: 2025, 2024, 2023, 2022, 2021. |
| 2026-08-24 | 2026-08-24: $5.481/gal | 2025-08-25: $3.328/gal | Low $3.038/gal (2021-08-23); high $4.619/gal (2022-08-22). 5 years: 2025, 2024, 2023, 2022, 2021. |
| 2026-08-31 | 2026-08-31: $5.360/gal | 2025-09-01: $3.367/gal | Low $3.060/gal (2021-08-30); high $4.821/gal (2022-08-29). 5 years: 2025, 2024, 2023, 2022, 2021. |
| 2026-09-07 | 2026-09-07: $5.754/gal | 2025-09-08: $3.404/gal | Low $3.104/gal (2021-09-06); high $4.796/gal (2022-09-05). 5 years: 2025, 2024, 2023, 2022, 2021. |
| 2026-09-14 | 2026-09-14: $6.027/gal | 2025-09-15: $3.389/gal | Low $3.099/gal (2021-09-13); high $4.760/gal (2022-09-12). 5 years: 2025, 2024, 2023, 2022, 2021. |
| 2026-09-21 | 2026-09-21: $6.177/gal | 2025-09-22: $3.400/gal | Low $3.119/gal (2021-09-20); high $4.690/gal (2022-09-19). 5 years: 2025, 2024, 2023, 2022, 2021. |
| 2026-09-28 | 2026-09-28: $5.955/gal | 2025-09-29: $3.413/gal | Low $3.142/gal (2021-09-27); high $4.623/gal (2022-09-26). 5 years: 2025, 2024, 2023, 2022, 2021. |
| 2026-10-05 | 2026-10-05: $5.819/gal | 2025-10-06: $3.364/gal | Low $3.203/gal (2021-10-04); high $4.557/gal (2022-10-03). 5 years: 2025, 2024, 2023, 2022, 2021. |
| 2026-10-12 | 2026-10-12: $5.809/gal | 2025-10-13: $3.299/gal | Low $3.299/gal (2025-10-13); high $4.897/gal (2022-10-10). 5 years: 2025, 2024, 2023, 2022, 2021. |
| 2026-10-19 | 2026-10-19: $5.903/gal | 2025-10-20: $3.256/gal | Low $3.199/gal (2024-10-21); high $5.018/gal (2022-10-17). 5 years: 2025, 2024, 2023, 2022, 2021. |
| 2026-10-26 | Unavailable | 2025-10-27: $3.350/gal | Low $3.230/gal (2024-10-28); high $4.987/gal (2022-10-24). 5 years: 2025, 2024, 2023, 2022, 2021. |
| 2026-11-02 | Unavailable | 2025-11-03: $3.374/gal | Low $3.184/gal (2024-11-04); high $4.965/gal (2022-10-31). 5 years: 2025, 2024, 2023, 2022, 2021. |
| 2026-11-09 | Unavailable | 2025-11-10: $3.436/gal | Low $3.170/gal (2024-11-11); high $4.937/gal (2022-11-07). 5 years: 2025, 2024, 2023, 2022, 2021. |
| 2026-11-16 | Unavailable | 2025-11-17: $3.490/gal | Low $3.153/gal (2024-11-18); high $4.886/gal (2022-11-14). 5 years: 2025, 2024, 2023, 2022, 2021. |
| 2026-11-23 | Unavailable | 2025-11-24: $3.459/gal | Low $3.203/gal (2024-11-25); high $4.782/gal (2022-11-21). 5 years: 2025, 2024, 2023, 2022, 2021. |
| 2026-11-30 | Unavailable | 2025-12-01: $3.415/gal | Low $3.227/gal (2024-12-02); high $4.699/gal (2022-11-28). 5 years: 2025, 2024, 2023, 2022, 2021. |
| 2026-12-07 | Unavailable | 2025-12-08: $3.327/gal | Low $3.130/gal (2024-12-09); high $4.524/gal (2022-12-05). 5 years: 2025, 2024, 2023, 2022, 2021. |
| 2026-12-14 | Unavailable | 2025-12-15: $3.267/gal | Low $3.190/gal (2024-12-16); high $4.344/gal (2022-12-12). 5 years: 2025, 2024, 2023, 2022, 2021. |
| 2026-12-21 | Unavailable | 2025-12-22: $3.214/gal | Low $3.154/gal (2024-12-23); high $4.205/gal (2022-12-19). 5 years: 2025, 2024, 2023, 2022, 2021. |
| 2026-12-28 | Unavailable | 2025-12-29: $3.184/gal | Low $3.184/gal (2025-12-29); high $4.164/gal (2022-12-26). 5 years: 2025, 2024, 2023, 2022, 2021. |
Comparison dates & method
Comparisons use the latest observation above and stay the same when you change the chart period. They use the provider values currently held in the local history, including available revisions.
The 52-week comparison uses an observation within 3 days of the date 364 days earlier. Actual comparison dates are shown above.
Seasonal context uses one observation within 3 days of the same calendar date in each of the previous 5 years, where available. At least 3 years are required. The displayed range describes those observations; it is not a forecast or a full-year high/low.
| Observation date | Value |
|---|---|
| 2025-10-20 | $3.256/gal |
| 2024-10-21 | $3.199/gal |
| 2023-10-16 | $4.114/gal |
| 2022-10-17 | $5.018/gal |
| 2021-10-18 | $3.422/gal |
History & comparisons — Rocky Mountain — diesel Seasonal chart available
2025-10-13 – 2026-10-19 · 54 observations
$/gal
Point to the chart, or focus it and use the left and right arrow keys, to inspect recorded values.
Available history only. Lines connect recorded observations; values between them are not supplied.
Recorded values
| Observation date | Value ($/gal) |
|---|---|
| 2025-10-13 | $3.658/gal |
| 2025-10-20 | $3.585/gal |
| 2025-10-27 | $3.686/gal |
| 2025-11-03 | $3.676/gal |
| 2025-11-10 | $3.803/gal |
| 2025-11-17 | $3.813/gal |
| 2025-11-24 | $3.723/gal |
| 2025-12-01 | $3.665/gal |
| 2025-12-08 | $3.498/gal |
| 2025-12-15 | $3.385/gal |
| 2025-12-22 | $3.304/gal |
| 2025-12-29 | $3.233/gal |
| 2026-01-05 | $3.222/gal |
| 2026-01-12 | $3.185/gal |
| 2026-01-19 | $3.246/gal |
| 2026-01-26 | $3.367/gal |
| 2026-02-02 | $3.419/gal |
| 2026-02-09 | $3.539/gal |
| 2026-02-16 | $3.607/gal |
| 2026-02-23 | $3.683/gal |
| 2026-03-02 | $3.737/gal |
| 2026-03-09 | $4.397/gal |
| 2026-03-16 | $4.796/gal |
| 2026-03-23 | $5.174/gal |
| 2026-03-30 | $5.270/gal |
| 2026-04-06 | $5.412/gal |
| 2026-04-13 | $5.256/gal |
| 2026-04-20 | $5.213/gal |
| 2026-04-27 | $5.270/gal |
| 2026-05-04 | $5.517/gal |
| 2026-05-11 | $5.491/gal |
| 2026-05-18 | $5.549/gal |
| 2026-05-25 | $5.493/gal |
| 2026-06-01 | $5.331/gal |
| 2026-06-08 | $5.200/gal |
| 2026-06-15 | $5.019/gal |
| 2026-06-22 | $4.795/gal |
| 2026-06-29 | $4.602/gal |
| 2026-07-06 | $4.484/gal |
| 2026-07-13 | $4.600/gal |
| 2026-07-20 | $4.935/gal |
| 2026-07-27 | $5.141/gal |
| 2026-08-03 | $5.285/gal |
| 2026-08-10 | $5.271/gal |
| 2026-08-17 | $5.427/gal |
| 2026-08-24 | $5.537/gal |
| 2026-08-31 | $5.555/gal |
| 2026-09-07 | $5.805/gal |
| 2026-09-14 | $6.066/gal |
| 2026-09-21 | $6.340/gal |
| 2026-09-28 | $6.407/gal |
| 2026-10-05 | $6.267/gal |
| 2026-10-12 | $6.302/gal |
| 2026-10-19 | $6.422/gal |
Latest observation comparisons
2026-10-19: $6.422/gal
52-week comparison
+$2.837/gal (+79.1%)
Compared with 2025-10-20: $3.585/gal.
Seasonal context
+$2.690/gal (+72.1%)
Compared with the same-season median of 5 available prior years: $3.732/gal.
Historical range: $3.585/gal to $5.268/gal.
Compare seasons — 2026 / 2025
Calendar-year comparison. 2026 data through 2026-10-19; later positions contain historical context only.
- 2026
- 2025
- Range of 3–5 prior years
$/gal
Point to the chart, or focus it and use the arrow keys, to compare a seasonal week. Home and End reach the first and last positions.
Weekly positions follow the latest observation’s weekday. Each year uses its nearest recorded observation within 3 days of that calendar date, within the same year. February 29 maps to February 28 in other years. Missing weeks break the lines and range; values are not filled in.
The shaded range uses the lowest and highest matched observations from the previous 5 calendar years, with at least 3 years at each position. Coverage can vary by week. This is historical context, not a forecast.
Seasonal dates & values
| Seasonal position | 2026 | 2025 | Historical range |
|---|---|---|---|
| 2026-01-05 | 2026-01-05: $3.222/gal | 2025-01-06: $3.430/gal | Low $2.586/gal (2021-01-04); high $4.730/gal (2023-01-02). 5 years: 2025, 2024, 2023, 2022, 2021. |
| 2026-01-12 | 2026-01-12: $3.185/gal | 2025-01-13: $3.399/gal | Low $2.590/gal (2021-01-11); high $4.697/gal (2023-01-09). 5 years: 2025, 2024, 2023, 2022, 2021. |
| 2026-01-19 | 2026-01-19: $3.246/gal | 2025-01-20: $3.485/gal | Low $2.603/gal (2021-01-18); high $4.729/gal (2023-01-16). 5 years: 2025, 2024, 2023, 2022, 2021. |
| 2026-01-26 | 2026-01-26: $3.367/gal | 2025-01-27: $3.431/gal | Low $2.613/gal (2021-01-25); high $4.736/gal (2023-01-23). 5 years: 2025, 2024, 2023, 2022, 2021. |
| 2026-02-02 | 2026-02-02: $3.419/gal | 2025-02-03: $3.471/gal | Low $2.641/gal (2021-02-01); high $4.742/gal (2023-01-30). 5 years: 2025, 2024, 2023, 2022, 2021. |
| 2026-02-09 | 2026-02-09: $3.539/gal | 2025-02-10: $3.528/gal | Low $2.699/gal (2021-02-08); high $4.741/gal (2023-02-06). 5 years: 2025, 2024, 2023, 2022, 2021. |
| 2026-02-16 | 2026-02-16: $3.607/gal | 2025-02-17: $3.510/gal | Low $2.787/gal (2021-02-15); high $4.660/gal (2023-02-13). 5 years: 2025, 2024, 2023, 2022, 2021. |
| 2026-02-23 | 2026-02-23: $3.683/gal | 2025-02-24: $3.495/gal | Low $2.856/gal (2021-02-22); high $4.621/gal (2023-02-20). 5 years: 2025, 2024, 2023, 2022, 2021. |
| 2026-03-02 | 2026-03-02: $3.737/gal | 2025-03-03: $3.478/gal | Low $2.983/gal (2021-03-01); high $4.559/gal (2023-02-27). 5 years: 2025, 2024, 2023, 2022, 2021. |
| 2026-03-09 | 2026-03-09: $4.397/gal | 2025-03-10: $3.414/gal | Low $3.131/gal (2021-03-08); high $4.542/gal (2022-03-07). 5 years: 2025, 2024, 2023, 2022, 2021. |
| 2026-03-16 | 2026-03-16: $4.796/gal | 2025-03-17: $3.376/gal | Low $3.276/gal (2021-03-15); high $4.966/gal (2022-03-14). 5 years: 2025, 2024, 2023, 2022, 2021. |
| 2026-03-23 | 2026-03-23: $5.174/gal | 2025-03-24: $3.415/gal | Low $3.317/gal (2021-03-22); high $4.887/gal (2022-03-21). 5 years: 2025, 2024, 2023, 2022, 2021. |
| 2026-03-30 | 2026-03-30: $5.270/gal | 2025-03-31: $3.472/gal | Low $3.294/gal (2021-03-29); high $5.044/gal (2022-03-28). 5 years: 2025, 2024, 2023, 2022, 2021. |
| 2026-04-06 | 2026-04-06: $5.412/gal | 2025-04-07: $3.499/gal | Low $3.279/gal (2021-04-05); high $5.055/gal (2022-04-04). 5 years: 2025, 2024, 2023, 2022, 2021. |
| 2026-04-13 | 2026-04-13: $5.256/gal | 2025-04-14: $3.480/gal | Low $3.256/gal (2021-04-12); high $5.042/gal (2022-04-11). 5 years: 2025, 2024, 2023, 2022, 2021. |
| 2026-04-20 | 2026-04-20: $5.213/gal | 2025-04-21: $3.477/gal | Low $3.232/gal (2021-04-19); high $5.094/gal (2022-04-18). 5 years: 2025, 2024, 2023, 2022, 2021. |
| 2026-04-27 | 2026-04-27: $5.270/gal | 2025-04-28: $3.470/gal | Low $3.228/gal (2021-04-26); high $5.154/gal (2022-04-25). 5 years: 2025, 2024, 2023, 2022, 2021. |
| 2026-05-04 | 2026-05-04: $5.517/gal | 2025-05-05: $3.460/gal | Low $3.250/gal (2021-05-03); high $5.406/gal (2022-05-02). 5 years: 2025, 2024, 2023, 2022, 2021. |
| 2026-05-11 | 2026-05-11: $5.491/gal | 2025-05-12: $3.463/gal | Low $3.307/gal (2021-05-10); high $5.461/gal (2022-05-09). 5 years: 2025, 2024, 2023, 2022, 2021. |
| 2026-05-18 | 2026-05-18: $5.549/gal | 2025-05-19: $3.512/gal | Low $3.361/gal (2021-05-17); high $5.468/gal (2022-05-16). 5 years: 2025, 2024, 2023, 2022, 2021. |
| 2026-05-25 | 2026-05-25: $5.493/gal | 2025-05-26: $3.445/gal | Low $3.362/gal (2021-05-24); high $5.498/gal (2022-05-23). 5 years: 2025, 2024, 2023, 2022, 2021. |
| 2026-06-01 | 2026-06-01: $5.331/gal | 2025-06-02: $3.453/gal | Low $3.377/gal (2021-05-31); high $5.494/gal (2022-05-30). 5 years: 2025, 2024, 2023, 2022, 2021. |
| 2026-06-08 | 2026-06-08: $5.200/gal | 2025-06-09: $3.481/gal | Low $3.386/gal (2021-06-07); high $5.591/gal (2022-06-06). 5 years: 2025, 2024, 2023, 2022, 2021. |
| 2026-06-15 | 2026-06-15: $5.019/gal | 2025-06-16: $3.548/gal | Low $3.382/gal (2021-06-14); high $5.692/gal (2022-06-13). 5 years: 2025, 2024, 2023, 2022, 2021. |
| 2026-06-22 | 2026-06-22: $4.795/gal | 2025-06-23: $3.689/gal | Low $3.393/gal (2021-06-21); high $5.782/gal (2022-06-20). 5 years: 2025, 2024, 2023, 2022, 2021. |
| 2026-06-29 | 2026-06-29: $4.602/gal | 2025-06-30: $3.659/gal | Low $3.433/gal (2021-06-28); high $5.770/gal (2022-06-27). 5 years: 2025, 2024, 2023, 2022, 2021. |
| 2026-07-06 | 2026-07-06: $4.484/gal | 2025-07-07: $3.666/gal | Low $3.516/gal (2021-07-05); high $5.732/gal (2022-07-04). 5 years: 2025, 2024, 2023, 2022, 2021. |
| 2026-07-13 | 2026-07-13: $4.600/gal | 2025-07-14: $3.713/gal | Low $3.594/gal (2021-07-12); high $5.674/gal (2022-07-11). 5 years: 2025, 2024, 2023, 2022, 2021. |
| 2026-07-20 | 2026-07-20: $4.935/gal | 2025-07-21: $3.770/gal | Low $3.634/gal (2021-07-19); high $5.546/gal (2022-07-18). 5 years: 2025, 2024, 2023, 2022, 2021. |
| 2026-07-27 | 2026-07-27: $5.141/gal | 2025-07-28: $3.781/gal | Low $3.647/gal (2021-07-26); high $5.389/gal (2022-07-25). 5 years: 2025, 2024, 2023, 2022, 2021. |
| 2026-08-03 | 2026-08-03: $5.285/gal | 2025-08-04: $3.793/gal | Low $3.666/gal (2021-08-02); high $5.181/gal (2022-08-01). 5 years: 2025, 2024, 2023, 2022, 2021. |
| 2026-08-10 | 2026-08-10: $5.271/gal | 2025-08-11: $3.776/gal | Low $3.675/gal (2021-08-09); high $5.040/gal (2022-08-08). 5 years: 2025, 2024, 2023, 2022, 2021. |
| 2026-08-17 | 2026-08-17: $5.427/gal | 2025-08-18: $3.757/gal | Low $3.650/gal (2024-08-19); high $4.963/gal (2022-08-15). 5 years: 2025, 2024, 2023, 2022, 2021. |
| 2026-08-24 | 2026-08-24: $5.537/gal | 2025-08-25: $3.748/gal | Low $3.608/gal (2024-08-26); high $4.885/gal (2022-08-22). 5 years: 2025, 2024, 2023, 2022, 2021. |
| 2026-08-31 | 2026-08-31: $5.555/gal | 2025-09-01: $3.753/gal | Low $3.590/gal (2024-09-02); high $4.972/gal (2022-08-29). 5 years: 2025, 2024, 2023, 2022, 2021. |
| 2026-09-07 | 2026-09-07: $5.805/gal | 2025-09-08: $3.754/gal | Low $3.567/gal (2024-09-09); high $4.971/gal (2022-09-05). 5 years: 2025, 2024, 2023, 2022, 2021. |
| 2026-09-14 | 2026-09-14: $6.066/gal | 2025-09-15: $3.722/gal | Low $3.588/gal (2024-09-16); high $4.961/gal (2022-09-12). 5 years: 2025, 2024, 2023, 2022, 2021. |
| 2026-09-21 | 2026-09-21: $6.340/gal | 2025-09-22: $3.747/gal | Low $3.608/gal (2024-09-23); high $4.932/gal (2022-09-19). 5 years: 2025, 2024, 2023, 2022, 2021. |
| 2026-09-28 | 2026-09-28: $6.407/gal | 2025-09-29: $3.732/gal | Low $3.605/gal (2021-09-27); high $4.885/gal (2022-09-26). 5 years: 2025, 2024, 2023, 2022, 2021. |
| 2026-10-05 | 2026-10-05: $6.267/gal | 2025-10-06: $3.671/gal | Low $3.620/gal (2024-10-07); high $4.870/gal (2022-10-03). 5 years: 2025, 2024, 2023, 2022, 2021. |
| 2026-10-12 | 2026-10-12: $6.302/gal | 2025-10-13: $3.658/gal | Low $3.635/gal (2024-10-14); high $5.199/gal (2022-10-10). 5 years: 2025, 2024, 2023, 2022, 2021. |
| 2026-10-19 | 2026-10-19: $6.422/gal | 2025-10-20: $3.585/gal | Low $3.585/gal (2025-10-20); high $5.268/gal (2022-10-17). 5 years: 2025, 2024, 2023, 2022, 2021. |
| 2026-10-26 | Unavailable | 2025-10-27: $3.686/gal | Low $3.655/gal (2024-10-28); high $5.338/gal (2022-10-24). 5 years: 2025, 2024, 2023, 2022, 2021. |
| 2026-11-02 | Unavailable | 2025-11-03: $3.676/gal | Low $3.583/gal (2024-11-04); high $5.302/gal (2022-10-31). 5 years: 2025, 2024, 2023, 2022, 2021. |
| 2026-11-09 | Unavailable | 2025-11-10: $3.803/gal | Low $3.525/gal (2024-11-11); high $5.338/gal (2022-11-07). 5 years: 2025, 2024, 2023, 2022, 2021. |
| 2026-11-16 | Unavailable | 2025-11-17: $3.813/gal | Low $3.458/gal (2024-11-18); high $5.401/gal (2022-11-14). 5 years: 2025, 2024, 2023, 2022, 2021. |
| 2026-11-23 | Unavailable | 2025-11-24: $3.723/gal | Low $3.450/gal (2024-11-25); high $5.438/gal (2022-11-21). 5 years: 2025, 2024, 2023, 2022, 2021. |
| 2026-11-30 | Unavailable | 2025-12-01: $3.665/gal | Low $3.431/gal (2024-12-02); high $5.392/gal (2022-11-28). 5 years: 2025, 2024, 2023, 2022, 2021. |
| 2026-12-07 | Unavailable | 2025-12-08: $3.498/gal | Low $3.329/gal (2024-12-09); high $5.250/gal (2022-12-05). 5 years: 2025, 2024, 2023, 2022, 2021. |
| 2026-12-14 | Unavailable | 2025-12-15: $3.385/gal | Low $3.357/gal (2024-12-16); high $5.027/gal (2022-12-12). 5 years: 2025, 2024, 2023, 2022, 2021. |
| 2026-12-21 | Unavailable | 2025-12-22: $3.304/gal | Low $3.304/gal (2025-12-22); high $4.860/gal (2022-12-19). 5 years: 2025, 2024, 2023, 2022, 2021. |
| 2026-12-28 | Unavailable | 2025-12-29: $3.233/gal | Low $3.233/gal (2025-12-29); high $4.745/gal (2022-12-26). 5 years: 2025, 2024, 2023, 2022, 2021. |
Comparison dates & method
Comparisons use the latest observation above and stay the same when you change the chart period. They use the provider values currently held in the local history, including available revisions.
The 52-week comparison uses an observation within 3 days of the date 364 days earlier. Actual comparison dates are shown above.
Seasonal context uses one observation within 3 days of the same calendar date in each of the previous 5 years, where available. At least 3 years are required. The displayed range describes those observations; it is not a forecast or a full-year high/low.
| Observation date | Value |
|---|---|
| 2025-10-20 | $3.585/gal |
| 2024-10-21 | $3.636/gal |
| 2023-10-16 | $4.664/gal |
| 2022-10-17 | $5.268/gal |
| 2021-10-18 | $3.732/gal |
History & comparisons — West Coast — diesel Seasonal chart available
2025-10-13 – 2026-10-19 · 54 observations
$/gal
Point to the chart, or focus it and use the left and right arrow keys, to inspect recorded values.
Available history only. Lines connect recorded observations; values between them are not supplied.
Recorded values
| Observation date | Value ($/gal) |
|---|---|
| 2025-10-13 | $4.464/gal |
| 2025-10-20 | $4.421/gal |
| 2025-10-27 | $4.485/gal |
| 2025-11-03 | $4.499/gal |
| 2025-11-10 | $4.545/gal |
| 2025-11-17 | $4.559/gal |
| 2025-11-24 | $4.514/gal |
| 2025-12-01 | $4.441/gal |
| 2025-12-08 | $4.370/gal |
| 2025-12-15 | $4.294/gal |
| 2025-12-22 | $4.205/gal |
| 2025-12-29 | $4.156/gal |
| 2026-01-05 | $4.128/gal |
| 2026-01-12 | $4.110/gal |
| 2026-01-19 | $4.189/gal |
| 2026-01-26 | $4.301/gal |
| 2026-02-02 | $4.377/gal |
| 2026-02-09 | $4.376/gal |
| 2026-02-16 | $4.383/gal |
| 2026-02-23 | $4.465/gal |
| 2026-03-02 | $4.534/gal |
| 2026-03-09 | $5.556/gal |
| 2026-03-16 | $5.856/gal |
| 2026-03-23 | $6.310/gal |
| 2026-03-30 | $6.596/gal |
| 2026-04-06 | $6.924/gal |
| 2026-04-13 | $6.822/gal |
| 2026-04-20 | $6.620/gal |
| 2026-04-27 | $6.530/gal |
| 2026-05-04 | $6.631/gal |
| 2026-05-11 | $6.562/gal |
| 2026-05-18 | $6.524/gal |
| 2026-05-25 | $6.500/gal |
| 2026-06-01 | $6.398/gal |
| 2026-06-08 | $6.289/gal |
| 2026-06-15 | $6.074/gal |
| 2026-06-22 | $5.809/gal |
| 2026-06-29 | $5.528/gal |
| 2026-07-06 | $5.425/gal |
| 2026-07-13 | $5.550/gal |
| 2026-07-20 | $5.877/gal |
| 2026-07-27 | $6.067/gal |
| 2026-08-03 | $6.130/gal |
| 2026-08-10 | $6.033/gal |
| 2026-08-17 | $6.203/gal |
| 2026-08-24 | $6.407/gal |
| 2026-08-31 | $6.497/gal |
| 2026-09-07 | $6.987/gal |
| 2026-09-14 | $7.250/gal |
| 2026-09-21 | $7.456/gal |
| 2026-09-28 | $7.357/gal |
| 2026-10-05 | $7.229/gal |
| 2026-10-12 | $7.240/gal |
| 2026-10-19 | $7.394/gal |
Latest observation comparisons
2026-10-19: $7.394/gal
52-week comparison
+$2.973/gal (+67.2%)
Compared with 2025-10-20: $4.421/gal.
Seasonal context
+$2.973/gal (+67.2%)
Compared with the same-season median of 5 available prior years: $4.421/gal.
Historical range: $4.210/gal to $5.997/gal.
Compare seasons — 2026 / 2025
Calendar-year comparison. 2026 data through 2026-10-19; later positions contain historical context only.
- 2026
- 2025
- Range of 3–5 prior years
$/gal
Point to the chart, or focus it and use the arrow keys, to compare a seasonal week. Home and End reach the first and last positions.
Weekly positions follow the latest observation’s weekday. Each year uses its nearest recorded observation within 3 days of that calendar date, within the same year. February 29 maps to February 28 in other years. Missing weeks break the lines and range; values are not filled in.
The shaded range uses the lowest and highest matched observations from the previous 5 calendar years, with at least 3 years at each position. Coverage can vary by week. This is historical context, not a forecast.
Seasonal dates & values
| Seasonal position | 2026 | 2025 | Historical range |
|---|---|---|---|
| 2026-01-05 | 2026-01-05: $4.128/gal | 2025-01-06: $4.147/gal | Low $3.116/gal (2021-01-04); high $5.091/gal (2023-01-02). 5 years: 2025, 2024, 2023, 2022, 2021. |
| 2026-01-12 | 2026-01-12: $4.110/gal | 2025-01-13: $4.213/gal | Low $3.139/gal (2021-01-11); high $5.080/gal (2023-01-09). 5 years: 2025, 2024, 2023, 2022, 2021. |
| 2026-01-19 | 2026-01-19: $4.189/gal | 2025-01-20: $4.302/gal | Low $3.155/gal (2021-01-18); high $5.034/gal (2023-01-16). 5 years: 2025, 2024, 2023, 2022, 2021. |
| 2026-01-26 | 2026-01-26: $4.301/gal | 2025-01-27: $4.274/gal | Low $3.176/gal (2021-01-25); high $5.095/gal (2023-01-23). 5 years: 2025, 2024, 2023, 2022, 2021. |
| 2026-02-02 | 2026-02-02: $4.377/gal | 2025-02-03: $4.289/gal | Low $3.199/gal (2021-02-01); high $5.126/gal (2023-01-30). 5 years: 2025, 2024, 2023, 2022, 2021. |
| 2026-02-09 | 2026-02-09: $4.376/gal | 2025-02-10: $4.307/gal | Low $3.258/gal (2021-02-08); high $5.086/gal (2023-02-06). 5 years: 2025, 2024, 2023, 2022, 2021. |
| 2026-02-16 | 2026-02-16: $4.383/gal | 2025-02-17: $4.316/gal | Low $3.328/gal (2021-02-15); high $5.033/gal (2023-02-13). 5 years: 2025, 2024, 2023, 2022, 2021. |
| 2026-02-23 | 2026-02-23: $4.465/gal | 2025-02-24: $4.358/gal | Low $3.432/gal (2021-02-22); high $4.972/gal (2023-02-20). 5 years: 2025, 2024, 2023, 2022, 2021. |
| 2026-03-02 | 2026-03-02: $4.534/gal | 2025-03-03: $4.303/gal | Low $3.541/gal (2021-03-01); high $4.933/gal (2023-02-27). 5 years: 2025, 2024, 2023, 2022, 2021. |
| 2026-03-09 | 2026-03-09: $5.556/gal | 2025-03-10: $4.250/gal | Low $3.593/gal (2021-03-08); high $5.393/gal (2022-03-07). 5 years: 2025, 2024, 2023, 2022, 2021. |
| 2026-03-16 | 2026-03-16: $5.856/gal | 2025-03-17: $4.203/gal | Low $3.641/gal (2021-03-15); high $5.867/gal (2022-03-14). 5 years: 2025, 2024, 2023, 2022, 2021. |
| 2026-03-23 | 2026-03-23: $6.310/gal | 2025-03-24: $4.229/gal | Low $3.678/gal (2021-03-22); high $5.797/gal (2022-03-21). 5 years: 2025, 2024, 2023, 2022, 2021. |
| 2026-03-30 | 2026-03-30: $6.596/gal | 2025-03-31: $4.259/gal | Low $3.659/gal (2021-03-29); high $5.874/gal (2022-03-28). 5 years: 2025, 2024, 2023, 2022, 2021. |
| 2026-04-06 | 2026-04-06: $6.924/gal | 2025-04-07: $4.318/gal | Low $3.653/gal (2021-04-05); high $5.832/gal (2022-04-04). 5 years: 2025, 2024, 2023, 2022, 2021. |
| 2026-04-13 | 2026-04-13: $6.822/gal | 2025-04-14: $4.281/gal | Low $3.644/gal (2021-04-12); high $5.761/gal (2022-04-11). 5 years: 2025, 2024, 2023, 2022, 2021. |
| 2026-04-20 | 2026-04-20: $6.620/gal | 2025-04-21: $4.250/gal | Low $3.645/gal (2021-04-19); high $5.795/gal (2022-04-18). 5 years: 2025, 2024, 2023, 2022, 2021. |
| 2026-04-27 | 2026-04-27: $6.530/gal | 2025-04-28: $4.224/gal | Low $3.651/gal (2021-04-26); high $5.841/gal (2022-04-25). 5 years: 2025, 2024, 2023, 2022, 2021. |
| 2026-05-04 | 2026-05-04: $6.631/gal | 2025-05-05: $4.204/gal | Low $3.664/gal (2021-05-03); high $6.021/gal (2022-05-02). 5 years: 2025, 2024, 2023, 2022, 2021. |
| 2026-05-11 | 2026-05-11: $6.562/gal | 2025-05-12: $4.211/gal | Low $3.692/gal (2021-05-10); high $6.071/gal (2022-05-09). 5 years: 2025, 2024, 2023, 2022, 2021. |
| 2026-05-18 | 2026-05-18: $6.524/gal | 2025-05-19: $4.296/gal | Low $3.735/gal (2021-05-17); high $6.075/gal (2022-05-16). 5 years: 2025, 2024, 2023, 2022, 2021. |
| 2026-05-25 | 2026-05-25: $6.500/gal | 2025-05-26: $4.248/gal | Low $3.751/gal (2021-05-24); high $6.081/gal (2022-05-23). 5 years: 2025, 2024, 2023, 2022, 2021. |
| 2026-06-01 | 2026-06-01: $6.398/gal | 2025-06-02: $4.221/gal | Low $3.762/gal (2021-05-31); high $6.134/gal (2022-05-30). 5 years: 2025, 2024, 2023, 2022, 2021. |
| 2026-06-08 | 2026-06-08: $6.289/gal | 2025-06-09: $4.217/gal | Low $3.786/gal (2021-06-07); high $6.441/gal (2022-06-06). 5 years: 2025, 2024, 2023, 2022, 2021. |
| 2026-06-15 | 2026-06-15: $6.074/gal | 2025-06-16: $4.310/gal | Low $3.802/gal (2021-06-14); high $6.423/gal (2022-06-13). 5 years: 2025, 2024, 2023, 2022, 2021. |
| 2026-06-22 | 2026-06-22: $5.809/gal | 2025-06-23: $4.458/gal | Low $3.809/gal (2021-06-21); high $6.516/gal (2022-06-20). 5 years: 2025, 2024, 2023, 2022, 2021. |
| 2026-06-29 | 2026-06-29: $5.528/gal | 2025-06-30: $4.421/gal | Low $3.839/gal (2021-06-28); high $6.480/gal (2022-06-27). 5 years: 2025, 2024, 2023, 2022, 2021. |
| 2026-07-06 | 2026-07-06: $5.425/gal | 2025-07-07: $4.462/gal | Low $3.896/gal (2021-07-05); high $6.389/gal (2022-07-04). 5 years: 2025, 2024, 2023, 2022, 2021. |
| 2026-07-13 | 2026-07-13: $5.550/gal | 2025-07-14: $4.498/gal | Low $3.905/gal (2021-07-12); high $6.285/gal (2022-07-11). 5 years: 2025, 2024, 2023, 2022, 2021. |
| 2026-07-20 | 2026-07-20: $5.877/gal | 2025-07-21: $4.542/gal | Low $3.929/gal (2021-07-19); high $6.116/gal (2022-07-18). 5 years: 2025, 2024, 2023, 2022, 2021. |
| 2026-07-27 | 2026-07-27: $6.067/gal | 2025-07-28: $4.546/gal | Low $3.934/gal (2021-07-26); high $5.982/gal (2022-07-25). 5 years: 2025, 2024, 2023, 2022, 2021. |
| 2026-08-03 | 2026-08-03: $6.130/gal | 2025-08-04: $4.540/gal | Low $3.993/gal (2021-08-02); high $5.803/gal (2022-08-01). 5 years: 2025, 2024, 2023, 2022, 2021. |
| 2026-08-10 | 2026-08-10: $6.033/gal | 2025-08-11: $4.492/gal | Low $4.009/gal (2021-08-09); high $5.630/gal (2022-08-08). 5 years: 2025, 2024, 2023, 2022, 2021. |
| 2026-08-17 | 2026-08-17: $6.203/gal | 2025-08-18: $4.455/gal | Low $4.029/gal (2021-08-16); high $5.541/gal (2022-08-15). 5 years: 2025, 2024, 2023, 2022, 2021. |
| 2026-08-24 | 2026-08-24: $6.407/gal | 2025-08-25: $4.461/gal | Low $3.992/gal (2021-08-23); high $5.548/gal (2022-08-22). 5 years: 2025, 2024, 2023, 2022, 2021. |
| 2026-08-31 | 2026-08-31: $6.497/gal | 2025-09-01: $4.484/gal | Low $3.997/gal (2021-08-30); high $5.719/gal (2022-08-29). 5 years: 2025, 2024, 2023, 2022, 2021. |
| 2026-09-07 | 2026-09-07: $6.987/gal | 2025-09-08: $4.533/gal | Low $4.020/gal (2021-09-06); high $5.693/gal (2022-09-05). 5 years: 2025, 2024, 2023, 2022, 2021. |
| 2026-09-14 | 2026-09-14: $7.250/gal | 2025-09-15: $4.523/gal | Low $4.016/gal (2021-09-13); high $5.658/gal (2022-09-12). 5 years: 2025, 2024, 2023, 2022, 2021. |
| 2026-09-21 | 2026-09-21: $7.456/gal | 2025-09-22: $4.524/gal | Low $4.026/gal (2021-09-20); high $5.695/gal (2023-09-18). 5 years: 2025, 2024, 2023, 2022, 2021. |
| 2026-09-28 | 2026-09-28: $7.357/gal | 2025-09-29: $4.532/gal | Low $4.032/gal (2021-09-27); high $5.687/gal (2023-09-25). 5 years: 2025, 2024, 2023, 2022, 2021. |
| 2026-10-05 | 2026-10-05: $7.229/gal | 2025-10-06: $4.499/gal | Low $4.072/gal (2021-10-04); high $5.694/gal (2023-10-02). 5 years: 2025, 2024, 2023, 2022, 2021. |
| 2026-10-12 | 2026-10-12: $7.240/gal | 2025-10-13: $4.464/gal | Low $4.133/gal (2021-10-11); high $5.972/gal (2022-10-10). 5 years: 2025, 2024, 2023, 2022, 2021. |
| 2026-10-19 | 2026-10-19: $7.394/gal | 2025-10-20: $4.421/gal | Low $4.210/gal (2024-10-21); high $5.997/gal (2022-10-17). 5 years: 2025, 2024, 2023, 2022, 2021. |
| 2026-10-26 | Unavailable | 2025-10-27: $4.485/gal | Low $4.206/gal (2024-10-28); high $5.876/gal (2022-10-24). 5 years: 2025, 2024, 2023, 2022, 2021. |
| 2026-11-02 | Unavailable | 2025-11-03: $4.499/gal | Low $4.190/gal (2024-11-04); high $5.810/gal (2022-10-31). 5 years: 2025, 2024, 2023, 2022, 2021. |
| 2026-11-09 | Unavailable | 2025-11-10: $4.545/gal | Low $4.180/gal (2024-11-11); high $5.764/gal (2022-11-07). 5 years: 2025, 2024, 2023, 2022, 2021. |
| 2026-11-16 | Unavailable | 2025-11-17: $4.559/gal | Low $4.149/gal (2024-11-18); high $5.769/gal (2022-11-14). 5 years: 2025, 2024, 2023, 2022, 2021. |
| 2026-11-23 | Unavailable | 2025-11-24: $4.514/gal | Low $4.177/gal (2024-11-25); high $5.744/gal (2022-11-21). 5 years: 2025, 2024, 2023, 2022, 2021. |
| 2026-11-30 | Unavailable | 2025-12-01: $4.441/gal | Low $4.164/gal (2024-12-02); high $5.666/gal (2022-11-28). 5 years: 2025, 2024, 2023, 2022, 2021. |
| 2026-12-07 | Unavailable | 2025-12-08: $4.370/gal | Low $4.119/gal (2024-12-09); high $5.502/gal (2022-12-05). 5 years: 2025, 2024, 2023, 2022, 2021. |
| 2026-12-14 | Unavailable | 2025-12-15: $4.294/gal | Low $4.130/gal (2024-12-16); high $5.287/gal (2022-12-12). 5 years: 2025, 2024, 2023, 2022, 2021. |
| 2026-12-21 | Unavailable | 2025-12-22: $4.205/gal | Low $4.079/gal (2024-12-23); high $5.138/gal (2022-12-19). 5 years: 2025, 2024, 2023, 2022, 2021. |
| 2026-12-28 | Unavailable | 2025-12-29: $4.156/gal | Low $4.110/gal (2024-12-30); high $5.068/gal (2022-12-26). 5 years: 2025, 2024, 2023, 2022, 2021. |
Comparison dates & method
Comparisons use the latest observation above and stay the same when you change the chart period. They use the provider values currently held in the local history, including available revisions.
The 52-week comparison uses an observation within 3 days of the date 364 days earlier. Actual comparison dates are shown above.
Seasonal context uses one observation within 3 days of the same calendar date in each of the previous 5 years, where available. At least 3 years are required. The displayed range describes those observations; it is not a forecast or a full-year high/low.
| Observation date | Value |
|---|---|
| 2025-10-20 | $4.421/gal |
| 2024-10-21 | $4.210/gal |
| 2023-10-16 | $5.528/gal |
| 2022-10-17 | $5.997/gal |
| 2021-10-18 | $4.226/gal |
Regional averages provide fuel-cost context; individual pump prices and negotiated fleet prices vary. EIA regional prices and methodology
Fuel-cost calculator
Apply a regional retail diesel average to your mileage and fuel economy, or to a known fuel volume. Compare the same volume at earlier observed prices.
Fuel cost = U.S. gallons × dollars per gallon. Gallons = miles ÷ miles per gallon. Interactive calculation requires JavaScript; the source observations below remain available.
Estimates use published retail averages including taxes. Actual station prices, discounts, fuel economy, idling and route conditions vary. This estimates fuel expense only, not a freight rate or surcharge. Inputs stay on this page and are not saved or sent.
Price observations and calculation method
| Region | USD per U.S. gallon | Observation | Source |
|---|---|---|---|
| U.S. average | $6.276 | 2026-10-19 | FRED |
| East Coast | $5.984 | 2026-10-19 | FRED |
| Midwest | $6.352 | 2026-10-19 | FRED |
| Gulf Coast | $5.903 | 2026-10-19 | FRED |
| Rocky Mountain | $6.422 | 2026-10-19 | FRED |
| West Coast | $7.394 | 2026-10-19 | FRED |
Gallons are calculated without intermediate rounding. Each difference holds fuel volume constant and changes only the observed price. Year-over-year uses the available observation nearest 52 weeks earlier, within three days; the actual reference date is shown. Different regions may have different reporting dates.
Transportation conditions
WeatherRegional land alerts and weather conditions
Regional conditions
Weather & Transportation Conditions
Weather exposure across production areas, distribution routes and bulk markets. Alerts identify weather conditions; confirmed closures and freight effects appear in our reporting.
The current map is unavailable here.
View the official weather map (opens in a new tab)This map is out of date. View the current NWS map (opens in a new tab)
What to watch in bulk transportation
Use these sector watchpoints to connect weather conditions with operator notices and reporting.
- Fuel, chemicals & gases
- Check plant and terminal power, loading access, supply interruptions and restart notices.
- Food & agriculture
- Check farm and plant access, pickup schedules, and grain movements through rail, river and export terminals.
- Construction & minerals
- Check rain- or freeze-sensitive work, site access and changes in delivery schedules.
- Water & liquid waste
- Check flooding at treatment sites, power availability and reported changes in collection or disposal access.
- Freight & carriers
- Check road restrictions, wind, visibility and detours along loading and delivery routes.
General planning context. An alert alone does not confirm a closure, a supply interruption or a change in freight rates.
Background: Roads (opens in a new tab) · Energy (opens in a new tab) · Agriculture (opens in a new tab) · Water (opens in a new tab)
Selected land alerts
The latest alert update is delayed. Last successful retrieval: Oct 22, 2026, 23:17 UTC. Check NWS for current conditions.
0 selected, unexpired alerts in this snapshot.
No selected, unexpired alerts are available in this snapshot. This is not an all-clear; check the NWS map for the full alert picture.
Selected storm, flood, winter, wind, visibility, temperature and fire-weather alerts over land. Region and state filters apply to the alert list; the map remains national. Snapshot conditions can change between updates; use NWS and local transportation authorities for trip decisions.
RiversSelected Mississippi and Ohio river gauges
Mississippi & Ohio corridors
Selected river conditions
Observed river stage at selected bulk transportation locations. Each level is measured against its own gauge datum; it is not channel depth or vessel clearance.
Mississippi River at St. Louis
8.59 ft gauge stage
Observed Oct 22, 2026, 22:30 UTC
Observation is not current. Last available reading shown.
Gauge reference
Stage is relative to this gauge's local zero. Negative stage can be valid.
NWS minor flood stage: 30.00 ft.
Gauge zero: 379.58 ft NAVD88.
Ohio River at Cairo
16.57 ft gauge stage
Observed Oct 22, 2026, 22:00 UTC
Observation is not current. Last available reading shown.
Gauge reference
Stage is relative to this gauge's local zero. Negative stage can be valid.
NWS minor flood stage: 40.00 ft.
Gauge zero: 270.03 ft NAVD88.
Gauge zero: 270.47 ft NGVD29.
Mississippi River at Memphis
2.39 ft gauge stage
Observed Oct 22, 2026, 22:00 UTC
Observation is not current. Last available reading shown.
Gauge reference
Stage is relative to this gauge's local zero. Negative stage can be valid.
NWS minor flood stage: 34.00 ft.
Gauge zero: 184.04 ft NAVD88.
Mississippi River at Vicksburg
15.54 ft gauge stage
Observed Oct 22, 2026, 22:00 UTC
Observation is not current. Last available reading shown.
Gauge reference
Stage is relative to this gauge's local zero. Negative stage can be valid.
NWS minor flood stage: 43.00 ft.
Reference elevation is unavailable here; see the NWS gauge page.
Mississippi River at Baton Rouge
10.78 ft gauge stage
Observed Oct 22, 2026, 22:00 UTC
Observation is not current. Last available reading shown.
Gauge reference
Stage is relative to this gauge's local zero. Negative stage can be valid.
NWS minor flood stage: 35.00 ft.
Reference elevation is unavailable here; see the NWS gauge page.
Source: NOAA/NWS National Water Prediction Service and its observing partners. Scheduled collection every 30 minutes. River levels provide context; navigation limits and terminal conditions require current notices from the responsible operators and authorities.
Road conditionsTraffic maps and official state road notices
Highway Traffic & Road Conditions
Traffic maps and official state closures, restrictions and advisories.
All official state road links
- Alabama (opens in a new tab)
- Alaska (opens in a new tab)
- Arizona (opens in a new tab)
- Arkansas (opens in a new tab)
- California (opens in a new tab)
- Colorado (opens in a new tab)
- Connecticut (opens in a new tab)
- Delaware (opens in a new tab)
- District of Columbia (opens in a new tab)
- Florida (opens in a new tab)
- Georgia (opens in a new tab)
- Hawaii (opens in a new tab)
- Idaho (opens in a new tab)
- Illinois (opens in a new tab)
- Indiana (opens in a new tab)
- Iowa (opens in a new tab)
- Kansas (opens in a new tab)
- Kentucky (opens in a new tab)
- Louisiana (opens in a new tab)
- Maine (opens in a new tab)
- Maryland (opens in a new tab)
- Massachusetts (opens in a new tab)
- Michigan (opens in a new tab)
- Minnesota (opens in a new tab)
- Mississippi (opens in a new tab)
- Missouri (opens in a new tab)
- Montana (opens in a new tab)
- Nebraska (opens in a new tab)
- Nevada (opens in a new tab)
- New Hampshire (opens in a new tab)
- New Jersey (opens in a new tab)
- New Mexico (opens in a new tab)
- New York (opens in a new tab)
- North Carolina (opens in a new tab)
- North Dakota (opens in a new tab)
- Ohio (opens in a new tab)
- Oklahoma (opens in a new tab)
- Oregon (opens in a new tab)
- Pennsylvania (opens in a new tab)
- Rhode Island (opens in a new tab)
- South Carolina (opens in a new tab)
- South Dakota (opens in a new tab)
- Tennessee (opens in a new tab)
- Texas (opens in a new tab)
- Utah (opens in a new tab)
- Vermont (opens in a new tab)
- Virginia (opens in a new tab)
- Washington (opens in a new tab)
- West Virginia (opens in a new tab)
- Wisconsin (opens in a new tab)
- Wyoming (opens in a new tab)
General traffic information. Check official restrictions for truck size, weight and hazardous materials; Waze is not truck-specific routing.
Petroleum & Renewable Fuels
Browse coverageRefining, distribution and investment across crude oil, gasoline, diesel, ethanol, biodiesel and renewable diesel.
History & comparisons — U.S. On-Highway Diesel Seasonal chart available
2025-10-13 – 2026-10-19 · 54 observations
$/gal
Point to the chart, or focus it and use the left and right arrow keys, to inspect recorded values.
Available history only. Lines connect recorded observations; values between them are not supplied.
Recorded values
| Observation date | Value ($/gal) |
|---|---|
| 2025-10-13 | $3.665/gal |
| 2025-10-20 | $3.620/gal |
| 2025-10-27 | $3.718/gal |
| 2025-11-03 | $3.753/gal |
| 2025-11-10 | $3.837/gal |
| 2025-11-17 | $3.868/gal |
| 2025-11-24 | $3.831/gal |
| 2025-12-01 | $3.758/gal |
| 2025-12-08 | $3.665/gal |
| 2025-12-15 | $3.607/gal |
| 2025-12-22 | $3.544/gal |
| 2025-12-29 | $3.500/gal |
| 2026-01-05 | $3.477/gal |
| 2026-01-12 | $3.459/gal |
| 2026-01-19 | $3.530/gal |
| 2026-01-26 | $3.624/gal |
| 2026-02-02 | $3.681/gal |
| 2026-02-09 | $3.688/gal |
| 2026-02-16 | $3.711/gal |
| 2026-02-23 | $3.809/gal |
| 2026-03-02 | $3.897/gal |
| 2026-03-09 | $4.859/gal |
| 2026-03-16 | $5.071/gal |
| 2026-03-23 | $5.375/gal |
| 2026-03-30 | $5.401/gal |
| 2026-04-06 | $5.643/gal |
| 2026-04-13 | $5.608/gal |
| 2026-04-20 | $5.403/gal |
| 2026-04-27 | $5.351/gal |
| 2026-05-04 | $5.640/gal |
| 2026-05-11 | $5.639/gal |
| 2026-05-18 | $5.596/gal |
| 2026-05-25 | $5.523/gal |
| 2026-06-01 | $5.350/gal |
| 2026-06-08 | $5.210/gal |
| 2026-06-15 | $5.059/gal |
| 2026-06-22 | $4.832/gal |
| 2026-06-29 | $4.668/gal |
| 2026-07-06 | $4.578/gal |
| 2026-07-13 | $4.796/gal |
| 2026-07-20 | $5.134/gal |
| 2026-07-27 | $5.313/gal |
| 2026-08-03 | $5.348/gal |
| 2026-08-10 | $5.257/gal |
| 2026-08-17 | $5.454/gal |
| 2026-08-24 | $5.652/gal |
| 2026-08-31 | $5.599/gal |
| 2026-09-07 | $5.967/gal |
| 2026-09-14 | $6.285/gal |
| 2026-09-21 | $6.529/gal |
| 2026-09-28 | $6.382/gal |
| 2026-10-05 | $6.199/gal |
| 2026-10-12 | $6.179/gal |
| 2026-10-19 | $6.276/gal |
Latest observation comparisons
2026-10-19: $6.276/gal
52-week comparison
+$2.656/gal (+73.4%)
Compared with 2025-10-20: $3.620/gal.
Seasonal context
+$2.605/gal (+71.0%)
Compared with the same-season median of 5 available prior years: $3.671/gal.
Historical range: $3.553/gal to $5.339/gal.
Compare seasons — 2026 / 2025
Calendar-year comparison. 2026 data through 2026-10-19; later positions contain historical context only.
- 2026
- 2025
- Range of 3–5 prior years
$/gal
Point to the chart, or focus it and use the arrow keys, to compare a seasonal week. Home and End reach the first and last positions.
Weekly positions follow the latest observation’s weekday. Each year uses its nearest recorded observation within 3 days of that calendar date, within the same year. February 29 maps to February 28 in other years. Missing weeks break the lines and range; values are not filled in.
The shaded range uses the lowest and highest matched observations from the previous 5 calendar years, with at least 3 years at each position. Coverage can vary by week. This is historical context, not a forecast.
Seasonal dates & values
| Seasonal position | 2026 | 2025 | Historical range |
|---|---|---|---|
| 2026-01-05 | 2026-01-05: $3.477/gal | 2025-01-06: $3.561/gal | Low $2.640/gal (2021-01-04); high $4.583/gal (2023-01-02). 5 years: 2025, 2024, 2023, 2022, 2021. |
| 2026-01-12 | 2026-01-12: $3.459/gal | 2025-01-13: $3.602/gal | Low $2.670/gal (2021-01-11); high $4.549/gal (2023-01-09). 5 years: 2025, 2024, 2023, 2022, 2021. |
| 2026-01-19 | 2026-01-19: $3.530/gal | 2025-01-20: $3.715/gal | Low $2.696/gal (2021-01-18); high $4.524/gal (2023-01-16). 5 years: 2025, 2024, 2023, 2022, 2021. |
| 2026-01-26 | 2026-01-26: $3.624/gal | 2025-01-27: $3.659/gal | Low $2.716/gal (2021-01-25); high $4.604/gal (2023-01-23). 5 years: 2025, 2024, 2023, 2022, 2021. |
| 2026-02-02 | 2026-02-02: $3.681/gal | 2025-02-03: $3.660/gal | Low $2.738/gal (2021-02-01); high $4.622/gal (2023-01-30). 5 years: 2025, 2024, 2023, 2022, 2021. |
| 2026-02-09 | 2026-02-09: $3.688/gal | 2025-02-10: $3.665/gal | Low $2.801/gal (2021-02-08); high $4.539/gal (2023-02-06). 5 years: 2025, 2024, 2023, 2022, 2021. |
| 2026-02-16 | 2026-02-16: $3.711/gal | 2025-02-17: $3.677/gal | Low $2.876/gal (2021-02-15); high $4.444/gal (2023-02-13). 5 years: 2025, 2024, 2023, 2022, 2021. |
| 2026-02-23 | 2026-02-23: $3.809/gal | 2025-02-24: $3.697/gal | Low $2.973/gal (2021-02-22); high $4.376/gal (2023-02-20). 5 years: 2025, 2024, 2023, 2022, 2021. |
| 2026-03-02 | 2026-03-02: $3.897/gal | 2025-03-03: $3.635/gal | Low $3.072/gal (2021-03-01); high $4.294/gal (2023-02-27). 5 years: 2025, 2024, 2023, 2022, 2021. |
| 2026-03-09 | 2026-03-09: $4.859/gal | 2025-03-10: $3.582/gal | Low $3.143/gal (2021-03-08); high $4.849/gal (2022-03-07). 5 years: 2025, 2024, 2023, 2022, 2021. |
| 2026-03-16 | 2026-03-16: $5.071/gal | 2025-03-17: $3.549/gal | Low $3.191/gal (2021-03-15); high $5.250/gal (2022-03-14). 5 years: 2025, 2024, 2023, 2022, 2021. |
| 2026-03-23 | 2026-03-23: $5.375/gal | 2025-03-24: $3.567/gal | Low $3.194/gal (2021-03-22); high $5.134/gal (2022-03-21). 5 years: 2025, 2024, 2023, 2022, 2021. |
| 2026-03-30 | 2026-03-30: $5.401/gal | 2025-03-31: $3.592/gal | Low $3.161/gal (2021-03-29); high $5.185/gal (2022-03-28). 5 years: 2025, 2024, 2023, 2022, 2021. |
| 2026-04-06 | 2026-04-06: $5.643/gal | 2025-04-07: $3.639/gal | Low $3.144/gal (2021-04-05); high $5.144/gal (2022-04-04). 5 years: 2025, 2024, 2023, 2022, 2021. |
| 2026-04-13 | 2026-04-13: $5.608/gal | 2025-04-14: $3.579/gal | Low $3.129/gal (2021-04-12); high $5.073/gal (2022-04-11). 5 years: 2025, 2024, 2023, 2022, 2021. |
| 2026-04-20 | 2026-04-20: $5.403/gal | 2025-04-21: $3.534/gal | Low $3.124/gal (2021-04-19); high $5.101/gal (2022-04-18). 5 years: 2025, 2024, 2023, 2022, 2021. |
| 2026-04-27 | 2026-04-27: $5.351/gal | 2025-04-28: $3.514/gal | Low $3.124/gal (2021-04-26); high $5.160/gal (2022-04-25). 5 years: 2025, 2024, 2023, 2022, 2021. |
| 2026-05-04 | 2026-05-04: $5.640/gal | 2025-05-05: $3.497/gal | Low $3.142/gal (2021-05-03); high $5.509/gal (2022-05-02). 5 years: 2025, 2024, 2023, 2022, 2021. |
| 2026-05-11 | 2026-05-11: $5.639/gal | 2025-05-12: $3.476/gal | Low $3.186/gal (2021-05-10); high $5.623/gal (2022-05-09). 5 years: 2025, 2024, 2023, 2022, 2021. |
| 2026-05-18 | 2026-05-18: $5.596/gal | 2025-05-19: $3.536/gal | Low $3.249/gal (2021-05-17); high $5.613/gal (2022-05-16). 5 years: 2025, 2024, 2023, 2022, 2021. |
| 2026-05-25 | 2026-05-25: $5.523/gal | 2025-05-26: $3.487/gal | Low $3.253/gal (2021-05-24); high $5.571/gal (2022-05-23). 5 years: 2025, 2024, 2023, 2022, 2021. |
| 2026-06-01 | 2026-06-01: $5.350/gal | 2025-06-02: $3.451/gal | Low $3.255/gal (2021-05-31); high $5.539/gal (2022-05-30). 5 years: 2025, 2024, 2023, 2022, 2021. |
| 2026-06-08 | 2026-06-08: $5.210/gal | 2025-06-09: $3.471/gal | Low $3.274/gal (2021-06-07); high $5.703/gal (2022-06-06). 5 years: 2025, 2024, 2023, 2022, 2021. |
| 2026-06-15 | 2026-06-15: $5.059/gal | 2025-06-16: $3.571/gal | Low $3.286/gal (2021-06-14); high $5.718/gal (2022-06-13). 5 years: 2025, 2024, 2023, 2022, 2021. |
| 2026-06-22 | 2026-06-22: $4.832/gal | 2025-06-23: $3.775/gal | Low $3.287/gal (2021-06-21); high $5.810/gal (2022-06-20). 5 years: 2025, 2024, 2023, 2022, 2021. |
| 2026-06-29 | 2026-06-29: $4.668/gal | 2025-06-30: $3.727/gal | Low $3.300/gal (2021-06-28); high $5.783/gal (2022-06-27). 5 years: 2025, 2024, 2023, 2022, 2021. |
| 2026-07-06 | 2026-07-06: $4.578/gal | 2025-07-07: $3.739/gal | Low $3.331/gal (2021-07-05); high $5.675/gal (2022-07-04). 5 years: 2025, 2024, 2023, 2022, 2021. |
| 2026-07-13 | 2026-07-13: $4.796/gal | 2025-07-14: $3.758/gal | Low $3.338/gal (2021-07-12); high $5.568/gal (2022-07-11). 5 years: 2025, 2024, 2023, 2022, 2021. |
| 2026-07-20 | 2026-07-20: $5.134/gal | 2025-07-21: $3.812/gal | Low $3.344/gal (2021-07-19); high $5.432/gal (2022-07-18). 5 years: 2025, 2024, 2023, 2022, 2021. |
| 2026-07-27 | 2026-07-27: $5.313/gal | 2025-07-28: $3.805/gal | Low $3.342/gal (2021-07-26); high $5.268/gal (2022-07-25). 5 years: 2025, 2024, 2023, 2022, 2021. |
| 2026-08-03 | 2026-08-03: $5.348/gal | 2025-08-04: $3.800/gal | Low $3.367/gal (2021-08-02); high $5.138/gal (2022-08-01). 5 years: 2025, 2024, 2023, 2022, 2021. |
| 2026-08-10 | 2026-08-10: $5.257/gal | 2025-08-11: $3.754/gal | Low $3.364/gal (2021-08-09); high $4.993/gal (2022-08-08). 5 years: 2025, 2024, 2023, 2022, 2021. |
| 2026-08-17 | 2026-08-17: $5.454/gal | 2025-08-18: $3.713/gal | Low $3.356/gal (2021-08-16); high $4.911/gal (2022-08-15). 5 years: 2025, 2024, 2023, 2022, 2021. |
| 2026-08-24 | 2026-08-24: $5.652/gal | 2025-08-25: $3.708/gal | Low $3.324/gal (2021-08-23); high $4.909/gal (2022-08-22). 5 years: 2025, 2024, 2023, 2022, 2021. |
| 2026-08-31 | 2026-08-31: $5.599/gal | 2025-09-01: $3.734/gal | Low $3.339/gal (2021-08-30); high $5.115/gal (2022-08-29). 5 years: 2025, 2024, 2023, 2022, 2021. |
| 2026-09-07 | 2026-09-07: $5.967/gal | 2025-09-08: $3.766/gal | Low $3.373/gal (2021-09-06); high $5.084/gal (2022-09-05). 5 years: 2025, 2024, 2023, 2022, 2021. |
| 2026-09-14 | 2026-09-14: $6.285/gal | 2025-09-15: $3.739/gal | Low $3.372/gal (2021-09-13); high $5.033/gal (2022-09-12). 5 years: 2025, 2024, 2023, 2022, 2021. |
| 2026-09-21 | 2026-09-21: $6.529/gal | 2025-09-22: $3.749/gal | Low $3.385/gal (2021-09-20); high $4.964/gal (2022-09-19). 5 years: 2025, 2024, 2023, 2022, 2021. |
| 2026-09-28 | 2026-09-28: $6.382/gal | 2025-09-29: $3.754/gal | Low $3.406/gal (2021-09-27); high $4.889/gal (2022-09-26). 5 years: 2025, 2024, 2023, 2022, 2021. |
| 2026-10-05 | 2026-10-05: $6.199/gal | 2025-10-06: $3.711/gal | Low $3.477/gal (2021-10-04); high $4.836/gal (2022-10-03). 5 years: 2025, 2024, 2023, 2022, 2021. |
| 2026-10-12 | 2026-10-12: $6.179/gal | 2025-10-13: $3.665/gal | Low $3.586/gal (2021-10-11); high $5.224/gal (2022-10-10). 5 years: 2025, 2024, 2023, 2022, 2021. |
| 2026-10-19 | 2026-10-19: $6.276/gal | 2025-10-20: $3.620/gal | Low $3.553/gal (2024-10-21); high $5.339/gal (2022-10-17). 5 years: 2025, 2024, 2023, 2022, 2021. |
| 2026-10-26 | Unavailable | 2025-10-27: $3.718/gal | Low $3.573/gal (2024-10-28); high $5.341/gal (2022-10-24). 5 years: 2025, 2024, 2023, 2022, 2021. |
| 2026-11-02 | Unavailable | 2025-11-03: $3.753/gal | Low $3.536/gal (2024-11-04); high $5.317/gal (2022-10-31). 5 years: 2025, 2024, 2023, 2022, 2021. |
| 2026-11-09 | Unavailable | 2025-11-10: $3.837/gal | Low $3.521/gal (2024-11-11); high $5.333/gal (2022-11-07). 5 years: 2025, 2024, 2023, 2022, 2021. |
| 2026-11-16 | Unavailable | 2025-11-17: $3.868/gal | Low $3.491/gal (2024-11-18); high $5.313/gal (2022-11-14). 5 years: 2025, 2024, 2023, 2022, 2021. |
| 2026-11-23 | Unavailable | 2025-11-24: $3.831/gal | Low $3.539/gal (2024-11-25); high $5.233/gal (2022-11-21). 5 years: 2025, 2024, 2023, 2022, 2021. |
| 2026-11-30 | Unavailable | 2025-12-01: $3.758/gal | Low $3.540/gal (2024-12-02); high $5.141/gal (2022-11-28). 5 years: 2025, 2024, 2023, 2022, 2021. |
| 2026-12-07 | Unavailable | 2025-12-08: $3.665/gal | Low $3.458/gal (2024-12-09); high $4.967/gal (2022-12-05). 5 years: 2025, 2024, 2023, 2022, 2021. |
| 2026-12-14 | Unavailable | 2025-12-15: $3.607/gal | Low $3.494/gal (2024-12-16); high $4.754/gal (2022-12-12). 5 years: 2025, 2024, 2023, 2022, 2021. |
| 2026-12-21 | Unavailable | 2025-12-22: $3.544/gal | Low $3.476/gal (2024-12-23); high $4.596/gal (2022-12-19). 5 years: 2025, 2024, 2023, 2022, 2021. |
| 2026-12-28 | Unavailable | 2025-12-29: $3.500/gal | Low $3.500/gal (2025-12-29); high $4.537/gal (2022-12-26). 5 years: 2025, 2024, 2023, 2022, 2021. |
Comparison dates & method
Comparisons use the latest observation above and stay the same when you change the chart period. They use the provider values currently held in the local history, including available revisions.
The 52-week comparison uses an observation within 3 days of the date 364 days earlier. Actual comparison dates are shown above.
Seasonal context uses one observation within 3 days of the same calendar date in each of the previous 5 years, where available. At least 3 years are required. The displayed range describes those observations; it is not a forecast or a full-year high/low.
| Observation date | Value |
|---|---|
| 2025-10-20 | $3.620/gal |
| 2024-10-21 | $3.553/gal |
| 2023-10-16 | $4.444/gal |
| 2022-10-17 | $5.339/gal |
| 2021-10-18 | $3.671/gal |
History & comparisons — U.S. Regular Gasoline Seasonal chart available
2025-10-13 – 2026-10-19 · 54 observations
$/gal
Point to the chart, or focus it and use the left and right arrow keys, to inspect recorded values.
Available history only. Lines connect recorded observations; values between them are not supplied.
Recorded values
| Observation date | Value ($/gal) |
|---|---|
| 2025-10-13 | $3.061/gal |
| 2025-10-20 | $3.019/gal |
| 2025-10-27 | $3.035/gal |
| 2025-11-03 | $3.019/gal |
| 2025-11-10 | $3.056/gal |
| 2025-11-17 | $3.062/gal |
| 2025-11-24 | $3.061/gal |
| 2025-12-01 | $2.985/gal |
| 2025-12-08 | $2.940/gal |
| 2025-12-15 | $2.895/gal |
| 2025-12-22 | $2.841/gal |
| 2025-12-29 | $2.811/gal |
| 2026-01-05 | $2.796/gal |
| 2026-01-12 | $2.779/gal |
| 2026-01-19 | $2.806/gal |
| 2026-01-26 | $2.853/gal |
| 2026-02-02 | $2.867/gal |
| 2026-02-09 | $2.902/gal |
| 2026-02-16 | $2.924/gal |
| 2026-02-23 | $2.937/gal |
| 2026-03-02 | $3.015/gal |
| 2026-03-09 | $3.502/gal |
| 2026-03-16 | $3.720/gal |
| 2026-03-23 | $3.961/gal |
| 2026-03-30 | $3.990/gal |
| 2026-04-06 | $4.120/gal |
| 2026-04-13 | $4.123/gal |
| 2026-04-20 | $4.044/gal |
| 2026-04-27 | $4.123/gal |
| 2026-05-04 | $4.452/gal |
| 2026-05-11 | $4.500/gal |
| 2026-05-18 | $4.490/gal |
| 2026-05-25 | $4.475/gal |
| 2026-06-01 | $4.305/gal |
| 2026-06-08 | $4.146/gal |
| 2026-06-15 | $4.052/gal |
| 2026-06-22 | $3.914/gal |
| 2026-06-29 | $3.831/gal |
| 2026-07-06 | $3.777/gal |
| 2026-07-13 | $3.855/gal |
| 2026-07-20 | $4.001/gal |
| 2026-07-27 | $4.096/gal |
| 2026-08-03 | $4.079/gal |
| 2026-08-10 | $4.006/gal |
| 2026-08-17 | $4.049/gal |
| 2026-08-24 | $4.085/gal |
| 2026-08-31 | $4.071/gal |
| 2026-09-07 | $4.157/gal |
| 2026-09-14 | $4.319/gal |
| 2026-09-21 | $4.478/gal |
| 2026-09-28 | $4.465/gal |
| 2026-10-05 | $4.354/gal |
| 2026-10-12 | $4.331/gal |
| 2026-10-19 | $4.284/gal |
Latest observation comparisons
2026-10-19: $4.284/gal
52-week comparison
+$1.265/gal (+41.9%)
Compared with 2025-10-20: $3.019/gal.
Seasonal context
+$0.962/gal (+29.0%)
Compared with the same-season median of 5 available prior years: $3.322/gal.
Historical range: $3.019/gal to $3.871/gal.
Compare seasons — 2026 / 2025
Calendar-year comparison. 2026 data through 2026-10-19; later positions contain historical context only.
- 2026
- 2025
- Range of 3–5 prior years
$/gal
Point to the chart, or focus it and use the arrow keys, to compare a seasonal week. Home and End reach the first and last positions.
Weekly positions follow the latest observation’s weekday. Each year uses its nearest recorded observation within 3 days of that calendar date, within the same year. February 29 maps to February 28 in other years. Missing weeks break the lines and range; values are not filled in.
The shaded range uses the lowest and highest matched observations from the previous 5 calendar years, with at least 3 years at each position. Coverage can vary by week. This is historical context, not a forecast.
Seasonal dates & values
| Seasonal position | 2026 | 2025 | Historical range |
|---|---|---|---|
| 2026-01-05 | 2026-01-05: $2.796/gal | 2025-01-06: $3.047/gal | Low $2.249/gal (2021-01-04); high $3.281/gal (2022-01-03). 5 years: 2025, 2024, 2023, 2022, 2021. |
| 2026-01-12 | 2026-01-12: $2.779/gal | 2025-01-13: $3.043/gal | Low $2.317/gal (2021-01-11); high $3.295/gal (2022-01-10). 5 years: 2025, 2024, 2023, 2022, 2021. |
| 2026-01-19 | 2026-01-19: $2.806/gal | 2025-01-20: $3.109/gal | Low $2.379/gal (2021-01-18); high $3.310/gal (2023-01-16). 5 years: 2025, 2024, 2023, 2022, 2021. |
| 2026-01-26 | 2026-01-26: $2.853/gal | 2025-01-27: $3.103/gal | Low $2.392/gal (2021-01-25); high $3.415/gal (2023-01-23). 5 years: 2025, 2024, 2023, 2022, 2021. |
| 2026-02-02 | 2026-02-02: $2.867/gal | 2025-02-03: $3.082/gal | Low $2.409/gal (2021-02-01); high $3.489/gal (2023-01-30). 5 years: 2025, 2024, 2023, 2022, 2021. |
| 2026-02-09 | 2026-02-09: $2.902/gal | 2025-02-10: $3.128/gal | Low $2.461/gal (2021-02-08); high $3.444/gal (2023-02-06). 5 years: 2025, 2024, 2023, 2022, 2021. |
| 2026-02-16 | 2026-02-16: $2.924/gal | 2025-02-17: $3.148/gal | Low $2.501/gal (2021-02-15); high $3.487/gal (2022-02-14). 5 years: 2025, 2024, 2023, 2022, 2021. |
| 2026-02-23 | 2026-02-23: $2.937/gal | 2025-02-24: $3.125/gal | Low $2.633/gal (2021-02-22); high $3.530/gal (2022-02-21). 5 years: 2025, 2024, 2023, 2022, 2021. |
| 2026-03-02 | 2026-03-02: $3.015/gal | 2025-03-03: $3.078/gal | Low $2.711/gal (2021-03-01); high $3.608/gal (2022-02-28). 5 years: 2025, 2024, 2023, 2022, 2021. |
| 2026-03-09 | 2026-03-09: $3.502/gal | 2025-03-10: $3.069/gal | Low $2.771/gal (2021-03-08); high $4.102/gal (2022-03-07). 5 years: 2025, 2024, 2023, 2022, 2021. |
| 2026-03-16 | 2026-03-16: $3.720/gal | 2025-03-17: $3.058/gal | Low $2.853/gal (2021-03-15); high $4.315/gal (2022-03-14). 5 years: 2025, 2024, 2023, 2022, 2021. |
| 2026-03-23 | 2026-03-23: $3.961/gal | 2025-03-24: $3.115/gal | Low $2.865/gal (2021-03-22); high $4.239/gal (2022-03-21). 5 years: 2025, 2024, 2023, 2022, 2021. |
| 2026-03-30 | 2026-03-30: $3.990/gal | 2025-03-31: $3.162/gal | Low $2.852/gal (2021-03-29); high $4.231/gal (2022-03-28). 5 years: 2025, 2024, 2023, 2022, 2021. |
| 2026-04-06 | 2026-04-06: $4.120/gal | 2025-04-07: $3.243/gal | Low $2.857/gal (2021-04-05); high $4.170/gal (2022-04-04). 5 years: 2025, 2024, 2023, 2022, 2021. |
| 2026-04-13 | 2026-04-13: $4.123/gal | 2025-04-14: $3.168/gal | Low $2.849/gal (2021-04-12); high $4.091/gal (2022-04-11). 5 years: 2025, 2024, 2023, 2022, 2021. |
| 2026-04-20 | 2026-04-20: $4.044/gal | 2025-04-21: $3.141/gal | Low $2.855/gal (2021-04-19); high $4.066/gal (2022-04-18). 5 years: 2025, 2024, 2023, 2022, 2021. |
| 2026-04-27 | 2026-04-27: $4.123/gal | 2025-04-28: $3.133/gal | Low $2.872/gal (2021-04-26); high $4.107/gal (2022-04-25). 5 years: 2025, 2024, 2023, 2022, 2021. |
| 2026-05-04 | 2026-05-04: $4.452/gal | 2025-05-05: $3.147/gal | Low $2.890/gal (2021-05-03); high $4.182/gal (2022-05-02). 5 years: 2025, 2024, 2023, 2022, 2021. |
| 2026-05-11 | 2026-05-11: $4.500/gal | 2025-05-12: $3.120/gal | Low $2.961/gal (2021-05-10); high $4.328/gal (2022-05-09). 5 years: 2025, 2024, 2023, 2022, 2021. |
| 2026-05-18 | 2026-05-18: $4.490/gal | 2025-05-19: $3.173/gal | Low $3.028/gal (2021-05-17); high $4.491/gal (2022-05-16). 5 years: 2025, 2024, 2023, 2022, 2021. |
| 2026-05-25 | 2026-05-25: $4.475/gal | 2025-05-26: $3.160/gal | Low $3.020/gal (2021-05-24); high $4.593/gal (2022-05-23). 5 years: 2025, 2024, 2023, 2022, 2021. |
| 2026-06-01 | 2026-06-01: $4.305/gal | 2025-06-02: $3.127/gal | Low $3.027/gal (2021-05-31); high $4.624/gal (2022-05-30). 5 years: 2025, 2024, 2023, 2022, 2021. |
| 2026-06-08 | 2026-06-08: $4.146/gal | 2025-06-09: $3.108/gal | Low $3.035/gal (2021-06-07); high $4.876/gal (2022-06-06). 5 years: 2025, 2024, 2023, 2022, 2021. |
| 2026-06-15 | 2026-06-15: $4.052/gal | 2025-06-16: $3.139/gal | Low $3.069/gal (2021-06-14); high $5.006/gal (2022-06-13). 5 years: 2025, 2024, 2023, 2022, 2021. |
| 2026-06-22 | 2026-06-22: $3.914/gal | 2025-06-23: $3.213/gal | Low $3.060/gal (2021-06-21); high $4.962/gal (2022-06-20). 5 years: 2025, 2024, 2023, 2022, 2021. |
| 2026-06-29 | 2026-06-29: $3.831/gal | 2025-06-30: $3.164/gal | Low $3.091/gal (2021-06-28); high $4.872/gal (2022-06-27). 5 years: 2025, 2024, 2023, 2022, 2021. |
| 2026-07-06 | 2026-07-06: $3.777/gal | 2025-07-07: $3.125/gal | Low $3.122/gal (2021-07-05); high $4.771/gal (2022-07-04). 5 years: 2025, 2024, 2023, 2022, 2021. |
| 2026-07-13 | 2026-07-13: $3.855/gal | 2025-07-14: $3.130/gal | Low $3.130/gal (2025-07-14); high $4.646/gal (2022-07-11). 5 years: 2025, 2024, 2023, 2022, 2021. |
| 2026-07-20 | 2026-07-20: $4.001/gal | 2025-07-21: $3.121/gal | Low $3.121/gal (2025-07-21); high $4.490/gal (2022-07-18). 5 years: 2025, 2024, 2023, 2022, 2021. |
| 2026-07-27 | 2026-07-27: $4.096/gal | 2025-07-28: $3.123/gal | Low $3.123/gal (2025-07-28); high $4.330/gal (2022-07-25). 5 years: 2025, 2024, 2023, 2022, 2021. |
| 2026-08-03 | 2026-08-03: $4.079/gal | 2025-08-04: $3.140/gal | Low $3.140/gal (2025-08-04); high $4.192/gal (2022-08-01). 5 years: 2025, 2024, 2023, 2022, 2021. |
| 2026-08-10 | 2026-08-10: $4.006/gal | 2025-08-11: $3.118/gal | Low $3.118/gal (2025-08-11); high $4.038/gal (2022-08-08). 5 years: 2025, 2024, 2023, 2022, 2021. |
| 2026-08-17 | 2026-08-17: $4.049/gal | 2025-08-18: $3.125/gal | Low $3.125/gal (2025-08-18); high $3.938/gal (2022-08-15). 5 years: 2025, 2024, 2023, 2022, 2021. |
| 2026-08-24 | 2026-08-24: $4.085/gal | 2025-08-25: $3.147/gal | Low $3.145/gal (2021-08-23); high $3.880/gal (2022-08-22). 5 years: 2025, 2024, 2023, 2022, 2021. |
| 2026-08-31 | 2026-08-31: $4.071/gal | 2025-09-01: $3.177/gal | Low $3.139/gal (2021-08-30); high $3.827/gal (2022-08-29). 5 years: 2025, 2024, 2023, 2022, 2021. |
| 2026-09-07 | 2026-09-07: $4.157/gal | 2025-09-08: $3.192/gal | Low $3.176/gal (2021-09-06); high $3.807/gal (2023-09-04). 5 years: 2025, 2024, 2023, 2022, 2021. |
| 2026-09-14 | 2026-09-14: $4.319/gal | 2025-09-15: $3.168/gal | Low $3.165/gal (2021-09-13); high $3.822/gal (2023-09-11). 5 years: 2025, 2024, 2023, 2022, 2021. |
| 2026-09-21 | 2026-09-21: $4.478/gal | 2025-09-22: $3.173/gal | Low $3.173/gal (2025-09-22); high $3.878/gal (2023-09-18). 5 years: 2025, 2024, 2023, 2022, 2021. |
| 2026-09-28 | 2026-09-28: $4.465/gal | 2025-09-29: $3.118/gal | Low $3.118/gal (2025-09-29); high $3.837/gal (2023-09-25). 5 years: 2025, 2024, 2023, 2022, 2021. |
| 2026-10-05 | 2026-10-05: $4.354/gal | 2025-10-06: $3.124/gal | Low $3.124/gal (2025-10-06); high $3.798/gal (2023-10-02). 5 years: 2025, 2024, 2023, 2022, 2021. |
| 2026-10-12 | 2026-10-12: $4.331/gal | 2025-10-13: $3.061/gal | Low $3.061/gal (2025-10-13); high $3.912/gal (2022-10-10). 5 years: 2025, 2024, 2023, 2022, 2021. |
| 2026-10-19 | 2026-10-19: $4.284/gal | 2025-10-20: $3.019/gal | Low $3.019/gal (2025-10-20); high $3.871/gal (2022-10-17). 5 years: 2025, 2024, 2023, 2022, 2021. |
| 2026-10-26 | Unavailable | 2025-10-27: $3.035/gal | Low $3.035/gal (2025-10-27); high $3.769/gal (2022-10-24). 5 years: 2025, 2024, 2023, 2022, 2021. |
| 2026-11-02 | Unavailable | 2025-11-03: $3.019/gal | Low $3.019/gal (2025-11-03); high $3.742/gal (2022-10-31). 5 years: 2025, 2024, 2023, 2022, 2021. |
| 2026-11-09 | Unavailable | 2025-11-10: $3.056/gal | Low $3.052/gal (2024-11-11); high $3.796/gal (2022-11-07). 5 years: 2025, 2024, 2023, 2022, 2021. |
| 2026-11-16 | Unavailable | 2025-11-17: $3.062/gal | Low $3.046/gal (2024-11-18); high $3.762/gal (2022-11-14). 5 years: 2025, 2024, 2023, 2022, 2021. |
| 2026-11-23 | Unavailable | 2025-11-24: $3.061/gal | Low $3.044/gal (2024-11-25); high $3.648/gal (2022-11-21). 5 years: 2025, 2024, 2023, 2022, 2021. |
| 2026-11-30 | Unavailable | 2025-12-01: $2.985/gal | Low $2.985/gal (2025-12-01); high $3.534/gal (2022-11-28). 5 years: 2025, 2024, 2023, 2022, 2021. |
| 2026-12-07 | Unavailable | 2025-12-08: $2.940/gal | Low $2.940/gal (2025-12-08); high $3.390/gal (2022-12-05). 5 years: 2025, 2024, 2023, 2022, 2021. |
| 2026-12-14 | Unavailable | 2025-12-15: $2.895/gal | Low $2.895/gal (2025-12-15); high $3.315/gal (2021-12-13). 5 years: 2025, 2024, 2023, 2022, 2021. |
| 2026-12-21 | Unavailable | 2025-12-22: $2.841/gal | Low $2.841/gal (2025-12-22); high $3.295/gal (2021-12-20). 5 years: 2025, 2024, 2023, 2022, 2021. |
| 2026-12-28 | Unavailable | 2025-12-29: $2.811/gal | Low $2.811/gal (2025-12-29); high $3.275/gal (2021-12-27). 5 years: 2025, 2024, 2023, 2022, 2021. |
Comparison dates & method
Comparisons use the latest observation above and stay the same when you change the chart period. They use the provider values currently held in the local history, including available revisions.
The 52-week comparison uses an observation within 3 days of the date 364 days earlier. Actual comparison dates are shown above.
Seasonal context uses one observation within 3 days of the same calendar date in each of the previous 5 years, where available. At least 3 years are required. The displayed range describes those observations; it is not a forecast or a full-year high/low.
| Observation date | Value |
|---|---|
| 2025-10-20 | $3.019/gal |
| 2024-10-21 | $3.144/gal |
| 2023-10-16 | $3.576/gal |
| 2022-10-17 | $3.871/gal |
| 2021-10-18 | $3.322/gal |
History & comparisons — WTI Crude
2025-10-17 – 2026-10-20 · 252 observations
$/bbl
Point to the chart, or focus it and use the left and right arrow keys, to inspect recorded values.
Available history only. Lines connect recorded observations; values between them are not supplied.
Recorded values
| Observation date | Value ($/bbl) |
|---|---|
| 2025-10-17 | $58.30/bbl |
| 2025-10-20 | $58.34/bbl |
| 2025-10-21 | $58.66/bbl |
| 2025-10-22 | $59.30/bbl |
| 2025-10-23 | $62.44/bbl |
| 2025-10-24 | $62.27/bbl |
| 2025-10-27 | $62.13/bbl |
| 2025-10-28 | $60.97/bbl |
| 2025-10-29 | $61.26/bbl |
| 2025-10-30 | $61.36/bbl |
| 2025-10-31 | $61.75/bbl |
| 2025-11-03 | $61.79/bbl |
| 2025-11-04 | $61.38/bbl |
| 2025-11-05 | $60.40/bbl |
| 2025-11-06 | $60.24/bbl |
| 2025-11-07 | $60.54/bbl |
| 2025-11-10 | $60.94/bbl |
| 2025-11-12 | $59.30/bbl |
| 2025-11-13 | $59.54/bbl |
| 2025-11-14 | $60.87/bbl |
| 2025-11-17 | $60.66/bbl |
| 2025-11-18 | $61.51/bbl |
| 2025-11-19 | $60.27/bbl |
| 2025-11-20 | $60.07/bbl |
| 2025-11-21 | $58.86/bbl |
| 2025-11-24 | $59.11/bbl |
| 2025-11-25 | $58.25/bbl |
| 2025-11-26 | $58.81/bbl |
| 2025-11-28 | $58.58/bbl |
| 2025-12-01 | $59.47/bbl |
| 2025-12-02 | $58.81/bbl |
| 2025-12-03 | $59.09/bbl |
| 2025-12-04 | $59.82/bbl |
| 2025-12-05 | $60.23/bbl |
| 2025-12-08 | $59.04/bbl |
| 2025-12-09 | $58.40/bbl |
| 2025-12-10 | $58.67/bbl |
| 2025-12-11 | $57.76/bbl |
| 2025-12-12 | $57.61/bbl |
| 2025-12-15 | $56.97/bbl |
| 2025-12-16 | $55.44/bbl |
| 2025-12-17 | $56.07/bbl |
| 2025-12-18 | $56.22/bbl |
| 2025-12-19 | $56.80/bbl |
| 2025-12-22 | $58.18/bbl |
| 2025-12-23 | $58.55/bbl |
| 2025-12-24 | $58.72/bbl |
| 2025-12-26 | $56.60/bbl |
| 2025-12-29 | $57.89/bbl |
| 2025-12-30 | $57.79/bbl |
| 2025-12-31 | $57.26/bbl |
| 2026-01-02 | $57.21/bbl |
| 2026-01-05 | $58.10/bbl |
| 2026-01-06 | $56.97/bbl |
| 2026-01-07 | $56.01/bbl |
| 2026-01-08 | $57.74/bbl |
| 2026-01-09 | $58.96/bbl |
| 2026-01-12 | $59.39/bbl |
| 2026-01-13 | $60.85/bbl |
| 2026-01-14 | $61.84/bbl |
| 2026-01-15 | $59.13/bbl |
| 2026-01-16 | $59.40/bbl |
| 2026-01-20 | $60.30/bbl |
| 2026-01-21 | $60.38/bbl |
| 2026-01-22 | $59.24/bbl |
| 2026-01-23 | $60.70/bbl |
| 2026-01-26 | $60.46/bbl |
| 2026-01-27 | $62.04/bbl |
| 2026-01-28 | $62.75/bbl |
| 2026-01-29 | $64.77/bbl |
| 2026-01-30 | $64.50/bbl |
| 2026-02-02 | $61.60/bbl |
| 2026-02-03 | $62.62/bbl |
| 2026-02-04 | $64.56/bbl |
| 2026-02-05 | $62.90/bbl |
| 2026-02-06 | $63.77/bbl |
| 2026-02-09 | $64.53/bbl |
| 2026-02-10 | $64.20/bbl |
| 2026-02-11 | $64.80/bbl |
| 2026-02-12 | $63.08/bbl |
| 2026-02-13 | $63.05/bbl |
| 2026-02-17 | $62.53/bbl |
| 2026-02-18 | $65.33/bbl |
| 2026-02-19 | $66.66/bbl |
| 2026-02-20 | $66.69/bbl |
| 2026-02-23 | $66.36/bbl |
| 2026-02-24 | $65.62/bbl |
| 2026-02-25 | $65.30/bbl |
| 2026-02-26 | $65.10/bbl |
| 2026-02-27 | $66.96/bbl |
| 2026-03-02 | $71.13/bbl |
| 2026-03-03 | $74.48/bbl |
| 2026-03-04 | $74.58/bbl |
| 2026-03-05 | $80.88/bbl |
| 2026-03-06 | $90.77/bbl |
| 2026-03-09 | $94.65/bbl |
| 2026-03-10 | $83.71/bbl |
| 2026-03-11 | $86.80/bbl |
| 2026-03-12 | $95.61/bbl |
| 2026-03-13 | $98.48/bbl |
| 2026-03-16 | $93.39/bbl |
| 2026-03-17 | $96.01/bbl |
| 2026-03-18 | $96.12/bbl |
| 2026-03-19 | $96.11/bbl |
| 2026-03-20 | $98.71/bbl |
| 2026-03-23 | $89.33/bbl |
| 2026-03-24 | $93.18/bbl |
| 2026-03-25 | $91.51/bbl |
| 2026-03-26 | $96.18/bbl |
| 2026-03-27 | $101.26/bbl |
| 2026-03-30 | $104.69/bbl |
| 2026-03-31 | $102.86/bbl |
| 2026-04-01 | $101.90/bbl |
| 2026-04-02 | $113.23/bbl |
| 2026-04-06 | $114.01/bbl |
| 2026-04-07 | $114.58/bbl |
| 2026-04-08 | $96.17/bbl |
| 2026-04-09 | $99.62/bbl |
| 2026-04-10 | $98.34/bbl |
| 2026-04-13 | $100.72/bbl |
| 2026-04-14 | $93.07/bbl |
| 2026-04-15 | $93.04/bbl |
| 2026-04-16 | $96.46/bbl |
| 2026-04-17 | $85.91/bbl |
| 2026-04-20 | $91.06/bbl |
| 2026-04-21 | $93.64/bbl |
| 2026-04-22 | $94.76/bbl |
| 2026-04-23 | $99.27/bbl |
| 2026-04-24 | $98.42/bbl |
| 2026-04-27 | $99.89/bbl |
| 2026-04-28 | $103.45/bbl |
| 2026-04-29 | $110.47/bbl |
| 2026-04-30 | $108.64/bbl |
| 2026-05-01 | $105.38/bbl |
| 2026-05-04 | $109.76/bbl |
| 2026-05-05 | $105.66/bbl |
| 2026-05-06 | $98.75/bbl |
| 2026-05-07 | $98.38/bbl |
| 2026-05-08 | $98.87/bbl |
| 2026-05-11 | $101.56/bbl |
| 2026-05-12 | $105.78/bbl |
| 2026-05-13 | $104.52/bbl |
| 2026-05-14 | $104.66/bbl |
| 2026-05-15 | $108.99/bbl |
| 2026-05-18 | $112.25/bbl |
| 2026-05-19 | $112.09/bbl |
| 2026-05-20 | $101.69/bbl |
| 2026-05-21 | $100.20/bbl |
| 2026-05-22 | $100.35/bbl |
| 2026-05-26 | $97.63/bbl |
| 2026-05-27 | $92.35/bbl |
| 2026-05-28 | $92.65/bbl |
| 2026-05-29 | $91.16/bbl |
| 2026-06-01 | $95.96/bbl |
| 2026-06-02 | $97.47/bbl |
| 2026-06-03 | $99.76/bbl |
| 2026-06-04 | $96.83/bbl |
| 2026-06-05 | $94.32/bbl |
| 2026-06-08 | $95.00/bbl |
| 2026-06-09 | $91.90/bbl |
| 2026-06-10 | $93.68/bbl |
| 2026-06-11 | $91.58/bbl |
| 2026-06-12 | $88.62/bbl |
| 2026-06-15 | $84.65/bbl |
| 2026-06-16 | $79.80/bbl |
| 2026-06-17 | $80.65/bbl |
| 2026-06-18 | $80.35/bbl |
| 2026-06-22 | $78.94/bbl |
| 2026-06-23 | $74.62/bbl |
| 2026-06-24 | $71.42/bbl |
| 2026-06-25 | $72.67/bbl |
| 2026-06-26 | $70.30/bbl |
| 2026-06-29 | $71.87/bbl |
| 2026-06-30 | $70.56/bbl |
| 2026-07-01 | $69.74/bbl |
| 2026-07-02 | $69.73/bbl |
| 2026-07-06 | $69.60/bbl |
| 2026-07-07 | $71.53/bbl |
| 2026-07-08 | $74.56/bbl |
| 2026-07-09 | $73.15/bbl |
| 2026-07-10 | $72.45/bbl |
| 2026-07-13 | $79.20/bbl |
| 2026-07-14 | $80.44/bbl |
| 2026-07-15 | $80.73/bbl |
| 2026-07-16 | $80.03/bbl |
| 2026-07-17 | $83.43/bbl |
| 2026-07-20 | $84.38/bbl |
| 2026-07-21 | $86.04/bbl |
| 2026-07-22 | $87.66/bbl |
| 2026-07-23 | $93.08/bbl |
| 2026-07-24 | $91.74/bbl |
| 2026-07-27 | $84.25/bbl |
| 2026-07-28 | $80.91/bbl |
| 2026-07-29 | $86.08/bbl |
| 2026-07-30 | $85.15/bbl |
| 2026-07-31 | $86.16/bbl |
| 2026-08-03 | $81.96/bbl |
| 2026-08-04 | $77.33/bbl |
| 2026-08-05 | $76.78/bbl |
| 2026-08-06 | $78.88/bbl |
| 2026-08-07 | $79.77/bbl |
| 2026-08-10 | $83.76/bbl |
| 2026-08-11 | $84.77/bbl |
| 2026-08-12 | $84.97/bbl |
| 2026-08-13 | $82.77/bbl |
| 2026-08-14 | $83.99/bbl |
| 2026-08-17 | $86.04/bbl |
| 2026-08-18 | $86.48/bbl |
| 2026-08-19 | $87.28/bbl |
| 2026-08-20 | $89.75/bbl |
| 2026-08-21 | $87.21/bbl |
| 2026-08-24 | $86.34/bbl |
| 2026-08-25 | $83.90/bbl |
| 2026-08-26 | $83.46/bbl |
| 2026-08-27 | $84.81/bbl |
| 2026-08-28 | $84.57/bbl |
| 2026-08-31 | $87.03/bbl |
| 2026-09-01 | $91.48/bbl |
| 2026-09-02 | $92.15/bbl |
| 2026-09-03 | $92.55/bbl |
| 2026-09-04 | $92.69/bbl |
| 2026-09-08 | $94.21/bbl |
| 2026-09-09 | $97.26/bbl |
| 2026-09-10 | $103.57/bbl |
| 2026-09-11 | $101.27/bbl |
| 2026-09-14 | $102.42/bbl |
| 2026-09-15 | $107.02/bbl |
| 2026-09-16 | $103.62/bbl |
| 2026-09-17 | $103.21/bbl |
| 2026-09-18 | $101.44/bbl |
| 2026-09-21 | $96.97/bbl |
| 2026-09-22 | $96.41/bbl |
| 2026-09-23 | $93.38/bbl |
| 2026-09-24 | $95.88/bbl |
| 2026-09-25 | $85.23/bbl |
| 2026-09-28 | $99.37/bbl |
| 2026-09-29 | $96.16/bbl |
| 2026-09-30 | $97.18/bbl |
| 2026-10-01 | $99.77/bbl |
| 2026-10-02 | $97.89/bbl |
| 2026-10-05 | $96.13/bbl |
| 2026-10-06 | $96.24/bbl |
| 2026-10-07 | $95.02/bbl |
| 2026-10-08 | $98.26/bbl |
| 2026-10-09 | $98.73/bbl |
| 2026-10-12 | $94.99/bbl |
| 2026-10-13 | $95.39/bbl |
| 2026-10-14 | $96.34/bbl |
| 2026-10-15 | $104.71/bbl |
| 2026-10-16 | $108.21/bbl |
| 2026-10-19 | $110.01/bbl |
| 2026-10-20 | $107.89/bbl |
Latest observation comparisons
2026-10-20: $107.89/bbl
Year-over-year
+$49.55/bbl (+84.9%)
Compared with 2025-10-20: $58.34/bbl.
Comparison dates & method
Comparisons use the latest observation above and stay the same when you change the chart period. They use the provider values currently held in the local history, including available revisions.
The yearly comparison uses the calendar anniversary, or the closest earlier recorded day within 4 days. February 29 is compared with February 28 in a non-leap year.
History & comparisons — Brent Crude
2025-10-17 – 2026-10-20 · 255 observations
$/bbl
Point to the chart, or focus it and use the left and right arrow keys, to inspect recorded values.
Available history only. Lines connect recorded observations; values between them are not supplied.
Recorded values
| Observation date | Value ($/bbl) |
|---|---|
| 2025-10-17 | $61.23/bbl |
| 2025-10-20 | $60.71/bbl |
| 2025-10-21 | $61.00/bbl |
| 2025-10-22 | $62.28/bbl |
| 2025-10-23 | $66.32/bbl |
| 2025-10-24 | $65.80/bbl |
| 2025-10-27 | $65.52/bbl |
| 2025-10-28 | $64.03/bbl |
| 2025-10-29 | $65.01/bbl |
| 2025-10-30 | $65.11/bbl |
| 2025-10-31 | $65.44/bbl |
| 2025-11-03 | $65.79/bbl |
| 2025-11-04 | $65.04/bbl |
| 2025-11-05 | $63.54/bbl |
| 2025-11-06 | $63.41/bbl |
| 2025-11-07 | $63.72/bbl |
| 2025-11-10 | $63.01/bbl |
| 2025-11-11 | $63.86/bbl |
| 2025-11-12 | $61.88/bbl |
| 2025-11-13 | $62.14/bbl |
| 2025-11-14 | $63.45/bbl |
| 2025-11-17 | $63.16/bbl |
| 2025-11-18 | $64.86/bbl |
| 2025-11-19 | $63.78/bbl |
| 2025-11-20 | $63.64/bbl |
| 2025-11-21 | $62.78/bbl |
| 2025-11-24 | $64.83/bbl |
| 2025-11-25 | $63.99/bbl |
| 2025-11-26 | $64.81/bbl |
| 2025-11-27 | $64.18/bbl |
| 2025-11-28 | $64.07/bbl |
| 2025-12-01 | $64.22/bbl |
| 2025-12-02 | $63.37/bbl |
| 2025-12-03 | $63.75/bbl |
| 2025-12-04 | $64.15/bbl |
| 2025-12-05 | $64.42/bbl |
| 2025-12-08 | $63.30/bbl |
| 2025-12-09 | $62.62/bbl |
| 2025-12-10 | $63.12/bbl |
| 2025-12-11 | $61.87/bbl |
| 2025-12-12 | $62.11/bbl |
| 2025-12-15 | $61.55/bbl |
| 2025-12-16 | $59.93/bbl |
| 2025-12-17 | $60.61/bbl |
| 2025-12-18 | $60.69/bbl |
| 2025-12-19 | $61.35/bbl |
| 2025-12-22 | $62.22/bbl |
| 2025-12-23 | $63.70/bbl |
| 2025-12-24 | $63.70/bbl |
| 2025-12-29 | $63.10/bbl |
| 2025-12-30 | $62.30/bbl |
| 2025-12-31 | $61.35/bbl |
| 2026-01-02 | $61.98/bbl |
| 2026-01-05 | $63.00/bbl |
| 2026-01-06 | $62.10/bbl |
| 2026-01-07 | $61.08/bbl |
| 2026-01-08 | $63.34/bbl |
| 2026-01-09 | $65.11/bbl |
| 2026-01-12 | $65.40/bbl |
| 2026-01-13 | $67.58/bbl |
| 2026-01-14 | $68.87/bbl |
| 2026-01-15 | $66.16/bbl |
| 2026-01-16 | $66.97/bbl |
| 2026-01-19 | $66.91/bbl |
| 2026-01-20 | $67.68/bbl |
| 2026-01-21 | $66.72/bbl |
| 2026-01-22 | $65.46/bbl |
| 2026-01-23 | $68.16/bbl |
| 2026-01-26 | $67.70/bbl |
| 2026-01-27 | $70.28/bbl |
| 2026-01-28 | $70.90/bbl |
| 2026-01-29 | $71.00/bbl |
| 2026-01-30 | $72.25/bbl |
| 2026-02-02 | $67.72/bbl |
| 2026-02-03 | $70.01/bbl |
| 2026-02-04 | $71.15/bbl |
| 2026-02-05 | $69.87/bbl |
| 2026-02-06 | $70.45/bbl |
| 2026-02-09 | $71.19/bbl |
| 2026-02-10 | $71.01/bbl |
| 2026-02-11 | $71.52/bbl |
| 2026-02-12 | $69.80/bbl |
| 2026-02-13 | $69.96/bbl |
| 2026-02-16 | $70.81/bbl |
| 2026-02-17 | $69.77/bbl |
| 2026-02-18 | $71.78/bbl |
| 2026-02-19 | $73.17/bbl |
| 2026-02-20 | $72.75/bbl |
| 2026-02-23 | $71.90/bbl |
| 2026-02-24 | $71.21/bbl |
| 2026-02-25 | $70.69/bbl |
| 2026-02-26 | $71.66/bbl |
| 2026-02-27 | $71.32/bbl |
| 2026-03-02 | $77.24/bbl |
| 2026-03-03 | $83.28/bbl |
| 2026-03-04 | $81.56/bbl |
| 2026-03-05 | $88.59/bbl |
| 2026-03-06 | $95.74/bbl |
| 2026-03-09 | $94.35/bbl |
| 2026-03-10 | $89.84/bbl |
| 2026-03-11 | $90.98/bbl |
| 2026-03-12 | $102.38/bbl |
| 2026-03-13 | $103.23/bbl |
| 2026-03-16 | $101.04/bbl |
| 2026-03-17 | $108.39/bbl |
| 2026-03-18 | $118.09/bbl |
| 2026-03-19 | $111.05/bbl |
| 2026-03-20 | $118.42/bbl |
| 2026-03-23 | $103.79/bbl |
| 2026-03-24 | $108.42/bbl |
| 2026-03-25 | $109.14/bbl |
| 2026-03-26 | $113.39/bbl |
| 2026-03-27 | $121.47/bbl |
| 2026-03-30 | $121.88/bbl |
| 2026-03-31 | $126.69/bbl |
| 2026-04-01 | $119.56/bbl |
| 2026-04-02 | $127.61/bbl |
| 2026-04-07 | $138.21/bbl |
| 2026-04-08 | $122.11/bbl |
| 2026-04-09 | $119.03/bbl |
| 2026-04-10 | $119.07/bbl |
| 2026-04-13 | $123.28/bbl |
| 2026-04-14 | $118.69/bbl |
| 2026-04-15 | $114.93/bbl |
| 2026-04-16 | $116.63/bbl |
| 2026-04-17 | $98.63/bbl |
| 2026-04-20 | $103.40/bbl |
| 2026-04-21 | $106.14/bbl |
| 2026-04-22 | $113.44/bbl |
| 2026-04-23 | $113.25/bbl |
| 2026-04-24 | $111.86/bbl |
| 2026-04-27 | $113.89/bbl |
| 2026-04-28 | $117.62/bbl |
| 2026-04-29 | $124.16/bbl |
| 2026-04-30 | $124.24/bbl |
| 2026-05-01 | $118.26/bbl |
| 2026-05-05 | $114.51/bbl |
| 2026-05-06 | $103.70/bbl |
| 2026-05-07 | $101.82/bbl |
| 2026-05-08 | $103.48/bbl |
| 2026-05-11 | $106.11/bbl |
| 2026-05-12 | $111.37/bbl |
| 2026-05-13 | $110.28/bbl |
| 2026-05-14 | $110.91/bbl |
| 2026-05-15 | $113.96/bbl |
| 2026-05-18 | $116.73/bbl |
| 2026-05-19 | $114.64/bbl |
| 2026-05-20 | $108.93/bbl |
| 2026-05-21 | $105.84/bbl |
| 2026-05-22 | $106.90/bbl |
| 2026-05-26 | $102.75/bbl |
| 2026-05-27 | $97.11/bbl |
| 2026-05-28 | $95.47/bbl |
| 2026-05-29 | $92.88/bbl |
| 2026-06-01 | $98.29/bbl |
| 2026-06-02 | $98.49/bbl |
| 2026-06-03 | $101.69/bbl |
| 2026-06-04 | $98.98/bbl |
| 2026-06-05 | $97.29/bbl |
| 2026-06-08 | $97.46/bbl |
| 2026-06-09 | $94.15/bbl |
| 2026-06-10 | $95.73/bbl |
| 2026-06-11 | $92.84/bbl |
| 2026-06-12 | $88.64/bbl |
| 2026-06-15 | $84.36/bbl |
| 2026-06-16 | $80.50/bbl |
| 2026-06-17 | $80.33/bbl |
| 2026-06-18 | $79.35/bbl |
| 2026-06-19 | $80.46/bbl |
| 2026-06-22 | $76.49/bbl |
| 2026-06-23 | $75.69/bbl |
| 2026-06-24 | $72.09/bbl |
| 2026-06-25 | $73.74/bbl |
| 2026-06-26 | $70.16/bbl |
| 2026-06-29 | $71.59/bbl |
| 2026-06-30 | $70.46/bbl |
| 2026-07-01 | $69.24/bbl |
| 2026-07-02 | $68.53/bbl |
| 2026-07-03 | $68.68/bbl |
| 2026-07-06 | $69.56/bbl |
| 2026-07-07 | $71.78/bbl |
| 2026-07-08 | $76.50/bbl |
| 2026-07-09 | $74.46/bbl |
| 2026-07-10 | $74.34/bbl |
| 2026-07-13 | $81.62/bbl |
| 2026-07-14 | $83.69/bbl |
| 2026-07-15 | $83.08/bbl |
| 2026-07-16 | $81.23/bbl |
| 2026-07-17 | $85.01/bbl |
| 2026-07-20 | $86.99/bbl |
| 2026-07-21 | $93.85/bbl |
| 2026-07-22 | $94.12/bbl |
| 2026-07-23 | $105.32/bbl |
| 2026-07-24 | $100.31/bbl |
| 2026-07-27 | $91.82/bbl |
| 2026-07-28 | $85.51/bbl |
| 2026-07-29 | $91.95/bbl |
| 2026-07-30 | $91.91/bbl |
| 2026-07-31 | $96.95/bbl |
| 2026-08-03 | $88.90/bbl |
| 2026-08-04 | $86.47/bbl |
| 2026-08-05 | $86.65/bbl |
| 2026-08-06 | $89.65/bbl |
| 2026-08-07 | $87.62/bbl |
| 2026-08-10 | $92.74/bbl |
| 2026-08-11 | $93.26/bbl |
| 2026-08-12 | $92.52/bbl |
| 2026-08-13 | $92.03/bbl |
| 2026-08-14 | $92.02/bbl |
| 2026-08-17 | $92.43/bbl |
| 2026-08-18 | $95.29/bbl |
| 2026-08-19 | $92.37/bbl |
| 2026-08-20 | $94.00/bbl |
| 2026-08-21 | $96.92/bbl |
| 2026-08-24 | $92.71/bbl |
| 2026-08-25 | $88.24/bbl |
| 2026-08-26 | $87.77/bbl |
| 2026-08-27 | $90.18/bbl |
| 2026-08-28 | $89.75/bbl |
| 2026-09-01 | $96.02/bbl |
| 2026-09-02 | $97.59/bbl |
| 2026-09-03 | $100.52/bbl |
| 2026-09-04 | $102.24/bbl |
| 2026-09-07 | $104.47/bbl |
| 2026-09-08 | $106.12/bbl |
| 2026-09-09 | $109.51/bbl |
| 2026-09-10 | $120.98/bbl |
| 2026-09-11 | $118.06/bbl |
| 2026-09-14 | $121.25/bbl |
| 2026-09-15 | $130.80/bbl |
| 2026-09-16 | $127.84/bbl |
| 2026-09-17 | $121.18/bbl |
| 2026-09-18 | $119.66/bbl |
| 2026-09-21 | $116.15/bbl |
| 2026-09-22 | $114.89/bbl |
| 2026-09-23 | $117.45/bbl |
| 2026-09-24 | $120.92/bbl |
| 2026-09-25 | $116.01/bbl |
| 2026-09-28 | $119.97/bbl |
| 2026-09-29 | $113.96/bbl |
| 2026-09-30 | $115.91/bbl |
| 2026-10-01 | $114.82/bbl |
| 2026-10-02 | $135.51/bbl |
| 2026-10-05 | $125.51/bbl |
| 2026-10-06 | $125.44/bbl |
| 2026-10-07 | $126.00/bbl |
| 2026-10-08 | $130.18/bbl |
| 2026-10-09 | $130.03/bbl |
| 2026-10-12 | $129.95/bbl |
| 2026-10-13 | $125.78/bbl |
| 2026-10-14 | $126.55/bbl |
| 2026-10-15 | $126.35/bbl |
| 2026-10-16 | $119.33/bbl |
| 2026-10-19 | $118.82/bbl |
| 2026-10-20 | $115.22/bbl |
Latest observation comparisons
2026-10-20: $115.22/bbl
Year-over-year
+$54.51/bbl (+89.8%)
Compared with 2025-10-20: $60.71/bbl.
Comparison dates & method
Comparisons use the latest observation above and stay the same when you change the chart period. They use the provider values currently held in the local history, including available revisions.
The yearly comparison uses the calendar anniversary, or the closest earlier recorded day within 4 days. February 29 is compared with February 28 in a non-leap year.
History & comparisons — Petroleum & Coal Product Output
2025-08-01 – 2026-09-01 · 14 observations
index (2017=100)
Point to the chart, or focus it and use the left and right arrow keys, to inspect recorded values.
Available history only. Lines connect recorded observations; values between them are not supplied.
Recorded values
| Observation date | Value (index (2017=100)) |
|---|---|
| 2025-08-01 | 89.5 index (2017=100) |
| 2025-09-01 | 89.8 index (2017=100) |
| 2025-10-01 | 88.5 index (2017=100) |
| 2025-11-01 | 89.6 index (2017=100) |
| 2025-12-01 | 90.5 index (2017=100) |
| 2026-01-01 | 89.7 index (2017=100) |
| 2026-02-01 | 89.8 index (2017=100) |
| 2026-03-01 | 90.8 index (2017=100) |
| 2026-04-01 | 90.0 index (2017=100) |
| 2026-05-01 | 87.4 index (2017=100) |
| 2026-06-01 | 90.3 index (2017=100) |
| 2026-07-01 | 90.0 index (2017=100) |
| 2026-08-01 | 90.0 index (2017=100) |
| 2026-09-01 | 90.6 index (2017=100) |
Latest observation comparisons
2026-09-01: 90.6 index (2017=100)
Year-over-year
+0.8 index points (+0.9%)
Compared with 2025-09-01: 89.8 index (2017=100).
Comparison dates & method
Comparisons use the latest observation above and stay the same when you change the chart period. They use the provider values currently held in the local history, including available revisions.
The yearly comparison uses the same reporting month in the previous calendar year.
U.S. fuel supply
Weekly national stocks and refinery operations. These observations provide supply context alongside prices.
U.S. end-of-week primary distillate stocks, including diesel and heating oil; not exclusively on-highway diesel or a measure of truck shipments.
History & comparisons — U.S. Distillate Fuel Oil Stocks Seasonal chart available
2025-10-10 – 2026-10-16 · 54 observations
million bbl
Point to the chart, or focus it and use the left and right arrow keys, to inspect recorded values.
Available history only. Lines connect recorded observations; values between them are not supplied.
Recorded values
| Observation date | Value (million bbl) |
|---|---|
| 2025-10-10 | 117.030 million bbl |
| 2025-10-17 | 115.551 million bbl |
| 2025-10-24 | 112.189 million bbl |
| 2025-10-31 | 111.546 million bbl |
| 2025-11-07 | 110.909 million bbl |
| 2025-11-14 | 111.080 million bbl |
| 2025-11-21 | 112.227 million bbl |
| 2025-11-28 | 114.286 million bbl |
| 2025-12-05 | 116.788 million bbl |
| 2025-12-12 | 118.500 million bbl |
| 2025-12-19 | 118.702 million bbl |
| 2025-12-26 | 123.679 million bbl |
| 2026-01-02 | 129.273 million bbl |
| 2026-01-09 | 129.244 million bbl |
| 2026-01-16 | 132.592 million bbl |
| 2026-01-23 | 132.921 million bbl |
| 2026-01-30 | 127.368 million bbl |
| 2026-02-06 | 124.665 million bbl |
| 2026-02-13 | 120.099 million bbl |
| 2026-02-20 | 120.351 million bbl |
| 2026-02-27 | 120.780 million bbl |
| 2026-03-06 | 119.431 million bbl |
| 2026-03-13 | 116.904 million bbl |
| 2026-03-20 | 119.936 million bbl |
| 2026-03-27 | 117.825 million bbl |
| 2026-04-03 | 114.681 million bbl |
| 2026-04-10 | 111.559 million bbl |
| 2026-04-17 | 108.132 million bbl |
| 2026-04-24 | 103.638 million bbl |
| 2026-05-01 | 102.344 million bbl |
| 2026-05-08 | 102.534 million bbl |
| 2026-05-15 | 102.906 million bbl |
| 2026-05-22 | 100.799 million bbl |
| 2026-05-29 | 102.301 million bbl |
| 2026-06-05 | 102.101 million bbl |
| 2026-06-12 | 103.052 million bbl |
| 2026-06-19 | 106.116 million bbl |
| 2026-06-26 | 108.599 million bbl |
| 2026-07-03 | 103.619 million bbl |
| 2026-07-10 | 108.175 million bbl |
| 2026-07-17 | 109.570 million bbl |
| 2026-07-24 | 110.632 million bbl |
| 2026-07-31 | 107.159 million bbl |
| 2026-08-07 | 107.149 million bbl |
| 2026-08-14 | 105.619 million bbl |
| 2026-08-21 | 103.391 million bbl |
| 2026-08-28 | 104.187 million bbl |
| 2026-09-04 | 106.274 million bbl |
| 2026-09-11 | 107.859 million bbl |
| 2026-09-18 | 107.431 million bbl |
| 2026-09-25 | 105.180 million bbl |
| 2026-10-02 | 105.138 million bbl |
| 2026-10-09 | 102.611 million bbl |
| 2026-10-16 | 104.286 million bbl |
Latest observation comparisons
2026-10-16: 104.286 million bbl
52-week comparison
−11.265 million bbl (−9.7%)
Compared with 2025-10-17: 115.551 million bbl.
Seasonal context
−9.553 million bbl (−8.4%)
Compared with the same-season median of 5 available prior years: 113.839 million bbl.
Historical range: 106.187 million bbl to 125.394 million bbl.
Compare seasons — 2026 / 2025
Calendar-year comparison. 2026 data through 2026-10-16; later positions contain historical context only.
- 2026
- 2025
- Range of 3–5 prior years
million bbl
Point to the chart, or focus it and use the arrow keys, to compare a seasonal week. Home and End reach the first and last positions.
Weekly positions follow the latest observation’s weekday. Each year uses its nearest recorded observation within 3 days of that calendar date, within the same year. February 29 maps to February 28 in other years. Missing weeks break the lines and range; values are not filled in.
The shaded range uses the lowest and highest matched observations from the previous 5 calendar years, with at least 3 years at each position. Coverage can vary by week. This is historical context, not a forecast.
Seasonal dates & values
| Seasonal position | 2026 | 2025 | Historical range |
|---|---|---|---|
| 2026-01-02 | 2026-01-02: 129.273 million bbl | 2025-01-03: 128.938 million bbl | Low 128.938 million bbl (2025-01-03); high 158.419 million bbl (2021-01-01). 3 years: 2025, 2024, 2021. |
| 2026-01-09 | 2026-01-09: 129.244 million bbl | 2025-01-10: 132.015 million bbl | Low 117.716 million bbl (2023-01-06); high 163.205 million bbl (2021-01-08). 5 years: 2025, 2024, 2023, 2022, 2021. |
| 2026-01-16 | 2026-01-16: 132.592 million bbl | 2025-01-17: 128.945 million bbl | Low 115.777 million bbl (2023-01-13); high 163.662 million bbl (2021-01-15). 5 years: 2025, 2024, 2023, 2022, 2021. |
| 2026-01-23 | 2026-01-23: 132.921 million bbl | 2025-01-24: 123.951 million bbl | Low 115.270 million bbl (2023-01-20); high 162.847 million bbl (2021-01-22). 5 years: 2025, 2024, 2023, 2022, 2021. |
| 2026-01-30 | 2026-01-30: 127.368 million bbl | 2025-01-31: 118.480 million bbl | Low 117.590 million bbl (2023-01-27); high 162.838 million bbl (2021-01-29). 5 years: 2025, 2024, 2023, 2022, 2021. |
| 2026-02-06 | 2026-02-06: 124.665 million bbl | 2025-02-07: 118.615 million bbl | Low 118.615 million bbl (2025-02-07); high 161.106 million bbl (2021-02-05). 5 years: 2025, 2024, 2023, 2022, 2021. |
| 2026-02-13 | 2026-02-13: 120.099 million bbl | 2025-02-14: 116.564 million bbl | Low 116.564 million bbl (2025-02-14); high 157.684 million bbl (2021-02-12). 5 years: 2025, 2024, 2023, 2022, 2021. |
| 2026-02-20 | 2026-02-20: 120.351 million bbl | 2025-02-21: 120.472 million bbl | Low 119.678 million bbl (2022-02-18); high 152.715 million bbl (2021-02-19). 5 years: 2025, 2024, 2023, 2022, 2021. |
| 2026-02-27 | 2026-02-27: 120.780 million bbl | 2025-02-28: 119.154 million bbl | Low 117.010 million bbl (2024-03-01); high 142.996 million bbl (2021-02-26). 5 years: 2025, 2024, 2023, 2022, 2021. |
| 2026-03-06 | 2026-03-06: 119.431 million bbl | 2025-03-07: 117.595 million bbl | Low 113.874 million bbl (2022-03-04); high 137.492 million bbl (2021-03-05). 5 years: 2025, 2024, 2023, 2022, 2021. |
| 2026-03-13 | 2026-03-13: 116.904 million bbl | 2025-03-14: 114.783 million bbl | Low 114.206 million bbl (2022-03-11); high 137.747 million bbl (2021-03-12). 5 years: 2025, 2024, 2023, 2022, 2021. |
| 2026-03-20 | 2026-03-20: 119.936 million bbl | 2025-03-21: 114.362 million bbl | Low 112.135 million bbl (2022-03-18); high 141.553 million bbl (2021-03-19). 5 years: 2025, 2024, 2023, 2022, 2021. |
| 2026-03-27 | 2026-03-27: 117.825 million bbl | 2025-03-28: 114.626 million bbl | Low 113.530 million bbl (2022-03-25); high 144.095 million bbl (2021-03-26). 5 years: 2025, 2024, 2023, 2022, 2021. |
| 2026-04-03 | 2026-04-03: 114.681 million bbl | 2025-04-04: 111.082 million bbl | Low 111.082 million bbl (2025-04-04); high 145.547 million bbl (2021-04-02). 5 years: 2025, 2024, 2023, 2022, 2021. |
| 2026-04-10 | 2026-04-10: 111.559 million bbl | 2025-04-11: 109.231 million bbl | Low 109.231 million bbl (2025-04-11); high 143.464 million bbl (2021-04-09). 5 years: 2025, 2024, 2023, 2022, 2021. |
| 2026-04-17 | 2026-04-17: 108.132 million bbl | 2025-04-18: 106.878 million bbl | Low 106.878 million bbl (2025-04-18); high 142.391 million bbl (2021-04-16). 5 years: 2025, 2024, 2023, 2022, 2021. |
| 2026-04-24 | 2026-04-24: 103.638 million bbl | 2025-04-25: 107.815 million bbl | Low 107.286 million bbl (2022-04-22); high 139.049 million bbl (2021-04-23). 5 years: 2025, 2024, 2023, 2022, 2021. |
| 2026-05-01 | 2026-05-01: 102.344 million bbl | 2025-05-02: 106.708 million bbl | Low 104.942 million bbl (2022-04-29); high 136.153 million bbl (2021-04-30). 5 years: 2025, 2024, 2023, 2022, 2021. |
| 2026-05-08 | 2026-05-08: 102.534 million bbl | 2025-05-09: 103.553 million bbl | Low 103.553 million bbl (2025-05-09); high 134.419 million bbl (2021-05-07). 5 years: 2025, 2024, 2023, 2022, 2021. |
| 2026-05-15 | 2026-05-15: 102.906 million bbl | 2025-05-16: 104.132 million bbl | Low 104.132 million bbl (2025-05-16); high 132.095 million bbl (2021-05-14). 5 years: 2025, 2024, 2023, 2022, 2021. |
| 2026-05-22 | 2026-05-22: 100.799 million bbl | 2025-05-23: 103.408 million bbl | Low 103.408 million bbl (2025-05-23); high 129.082 million bbl (2021-05-21). 5 years: 2025, 2024, 2023, 2022, 2021. |
| 2026-05-29 | 2026-05-29: 102.301 million bbl | 2025-05-30: 107.638 million bbl | Low 106.392 million bbl (2022-05-27); high 132.802 million bbl (2021-05-28). 5 years: 2025, 2024, 2023, 2022, 2021. |
| 2026-06-05 | 2026-06-05: 102.101 million bbl | 2025-06-06: 108.884 million bbl | Low 108.884 million bbl (2025-06-06); high 137.214 million bbl (2021-06-04). 5 years: 2025, 2024, 2023, 2022, 2021. |
| 2026-06-12 | 2026-06-12: 103.052 million bbl | 2025-06-13: 109.398 million bbl | Low 109.398 million bbl (2025-06-13); high 136.191 million bbl (2021-06-11). 5 years: 2025, 2024, 2023, 2022, 2021. |
| 2026-06-19 | 2026-06-19: 106.116 million bbl | 2025-06-20: 105.332 million bbl | Low 105.332 million bbl (2025-06-20); high 137.945 million bbl (2021-06-18). 5 years: 2025, 2024, 2023, 2022, 2021. |
| 2026-06-26 | 2026-06-26: 108.599 million bbl | 2025-06-27: 103.622 million bbl | Low 103.622 million bbl (2025-06-27); high 137.076 million bbl (2021-06-25). 5 years: 2025, 2024, 2023, 2022, 2021. |
| 2026-07-03 | 2026-07-03: 103.619 million bbl | 2025-07-04: 102.797 million bbl | Low 102.797 million bbl (2025-07-04); high 138.692 million bbl (2021-07-02). 5 years: 2025, 2024, 2023, 2022, 2021. |
| 2026-07-10 | 2026-07-10: 108.175 million bbl | 2025-07-11: 106.970 million bbl | Low 106.970 million bbl (2025-07-11); high 142.349 million bbl (2021-07-09). 5 years: 2025, 2024, 2023, 2022, 2021. |
| 2026-07-17 | 2026-07-17: 109.570 million bbl | 2025-07-18: 109.901 million bbl | Low 109.901 million bbl (2025-07-18); high 141.000 million bbl (2021-07-16). 5 years: 2025, 2024, 2023, 2022, 2021. |
| 2026-07-24 | 2026-07-24: 110.632 million bbl | 2025-07-25: 113.536 million bbl | Low 111.724 million bbl (2022-07-22); high 137.912 million bbl (2021-07-23). 5 years: 2025, 2024, 2023, 2022, 2021. |
| 2026-07-31 | 2026-07-31: 107.159 million bbl | 2025-08-01: 112.971 million bbl | Low 109.324 million bbl (2022-07-29); high 138.744 million bbl (2021-07-30). 5 years: 2025, 2024, 2023, 2022, 2021. |
| 2026-08-07 | 2026-08-07: 107.149 million bbl | 2025-08-08: 113.685 million bbl | Low 111.490 million bbl (2022-08-05); high 140.511 million bbl (2021-08-06). 5 years: 2025, 2024, 2023, 2022, 2021. |
| 2026-08-14 | 2026-08-14: 105.619 million bbl | 2025-08-15: 116.028 million bbl | Low 112.256 million bbl (2022-08-12); high 137.814 million bbl (2021-08-13). 5 years: 2025, 2024, 2023, 2022, 2021. |
| 2026-08-21 | 2026-08-21: 103.391 million bbl | 2025-08-22: 114.242 million bbl | Low 111.594 million bbl (2022-08-19); high 138.459 million bbl (2021-08-20). 5 years: 2025, 2024, 2023, 2022, 2021. |
| 2026-08-28 | 2026-08-28: 104.187 million bbl | 2025-08-29: 115.923 million bbl | Low 111.706 million bbl (2022-08-26); high 136.727 million bbl (2021-08-27). 5 years: 2025, 2024, 2023, 2022, 2021. |
| 2026-09-04 | 2026-09-04: 106.274 million bbl | 2025-09-05: 120.638 million bbl | Low 111.801 million bbl (2022-09-02); high 133.586 million bbl (2021-09-03). 5 years: 2025, 2024, 2023, 2022, 2021. |
| 2026-09-11 | 2026-09-11: 107.859 million bbl | 2025-09-12: 124.684 million bbl | Low 116.020 million bbl (2022-09-09); high 131.897 million bbl (2021-09-10). 5 years: 2025, 2024, 2023, 2022, 2021. |
| 2026-09-18 | 2026-09-18: 107.431 million bbl | 2025-09-19: 122.999 million bbl | Low 117.250 million bbl (2022-09-16); high 129.343 million bbl (2021-09-17). 5 years: 2025, 2024, 2023, 2022, 2021. |
| 2026-09-25 | 2026-09-25: 105.180 million bbl | 2025-09-26: 123.577 million bbl | Low 114.359 million bbl (2022-09-23); high 129.727 million bbl (2021-09-24). 5 years: 2025, 2024, 2023, 2022, 2021. |
| 2026-10-02 | 2026-10-02: 105.138 million bbl | 2025-10-03: 121.559 million bbl | Low 110.916 million bbl (2022-09-30); high 129.331 million bbl (2021-10-01). 5 years: 2025, 2024, 2023, 2022, 2021. |
| 2026-10-09 | 2026-10-09: 102.611 million bbl | 2025-10-10: 117.030 million bbl | Low 106.063 million bbl (2022-10-07); high 129.307 million bbl (2021-10-08). 5 years: 2025, 2024, 2023, 2022, 2021. |
| 2026-10-16 | 2026-10-16: 104.286 million bbl | 2025-10-17: 115.551 million bbl | Low 106.187 million bbl (2022-10-14); high 125.394 million bbl (2021-10-15). 5 years: 2025, 2024, 2023, 2022, 2021. |
| 2026-10-23 | Unavailable | 2025-10-24: 112.189 million bbl | Low 106.357 million bbl (2022-10-21); high 124.962 million bbl (2021-10-22). 5 years: 2025, 2024, 2023, 2022, 2021. |
| 2026-10-30 | Unavailable | 2025-10-31: 111.546 million bbl | Low 106.784 million bbl (2022-10-28); high 127.122 million bbl (2021-10-29). 5 years: 2025, 2024, 2023, 2022, 2021. |
| 2026-11-06 | Unavailable | 2025-11-07: 110.909 million bbl | Low 106.263 million bbl (2022-11-04); high 124.509 million bbl (2021-11-05). 5 years: 2025, 2024, 2023, 2022, 2021. |
| 2026-11-13 | Unavailable | 2025-11-14: 111.080 million bbl | Low 106.579 million bbl (2023-11-10); high 123.685 million bbl (2021-11-12). 5 years: 2025, 2024, 2023, 2022, 2021. |
| 2026-11-20 | Unavailable | 2025-11-21: 112.227 million bbl | Low 105.561 million bbl (2023-11-17); high 121.717 million bbl (2021-11-19). 5 years: 2025, 2024, 2023, 2022, 2021. |
| 2026-11-27 | Unavailable | 2025-11-28: 114.286 million bbl | Low 110.778 million bbl (2023-11-24); high 123.877 million bbl (2021-11-26). 5 years: 2025, 2024, 2023, 2022, 2021. |
| 2026-12-04 | Unavailable | 2025-12-05: 116.788 million bbl | Low 112.045 million bbl (2023-12-01); high 126.610 million bbl (2021-12-03). 5 years: 2025, 2024, 2023, 2022, 2021. |
| 2026-12-11 | Unavailable | 2025-12-12: 118.500 million bbl | Low 113.539 million bbl (2023-12-08); high 123.758 million bbl (2021-12-10). 5 years: 2025, 2024, 2023, 2022, 2021. |
| 2026-12-18 | Unavailable | 2025-12-19: 118.702 million bbl | Low 115.024 million bbl (2023-12-15); high 124.154 million bbl (2021-12-17). 5 years: 2025, 2024, 2023, 2022, 2021. |
| 2026-12-25 | Unavailable | 2025-12-26: 123.679 million bbl | Low 115.765 million bbl (2023-12-22); high 123.679 million bbl (2025-12-26). 5 years: 2025, 2024, 2023, 2022, 2021. |
Comparison dates & method
Comparisons use the latest observation above and stay the same when you change the chart period. They use the provider values currently held in the local history, including available revisions.
The 52-week comparison uses an observation within 3 days of the date 364 days earlier. Actual comparison dates are shown above.
Seasonal context uses one observation within 3 days of the same calendar date in each of the previous 5 years, where available. At least 3 years are required. The displayed range describes those observations; it is not a forecast or a full-year high/low.
| Observation date | Value |
|---|---|
| 2025-10-17 | 115.551 million bbl |
| 2024-10-18 | 113.839 million bbl |
| 2023-10-13 | 113.773 million bbl |
| 2022-10-14 | 106.187 million bbl |
| 2021-10-15 | 125.394 million bbl |
U.S. weekly gross refinery inputs as a percentage of operable capacity; a refining-activity indicator, not fuel availability at an individual terminal.
History & comparisons — U.S. Refinery Utilization Seasonal chart available
2025-10-10 – 2026-10-16 · 54 observations
%
Point to the chart, or focus it and use the left and right arrow keys, to inspect recorded values.
Available history only. Lines connect recorded observations; values between them are not supplied.
Recorded values
| Observation date | Value (%) |
|---|---|
| 2025-10-10 | 85.7 % |
| 2025-10-17 | 88.6 % |
| 2025-10-24 | 86.6 % |
| 2025-10-31 | 86.0 % |
| 2025-11-07 | 89.4 % |
| 2025-11-14 | 90.0 % |
| 2025-11-21 | 92.3 % |
| 2025-11-28 | 94.1 % |
| 2025-12-05 | 94.5 % |
| 2025-12-12 | 94.8 % |
| 2025-12-19 | 94.6 % |
| 2025-12-26 | 94.7 % |
| 2026-01-02 | 94.7 % |
| 2026-01-09 | 95.3 % |
| 2026-01-16 | 93.3 % |
| 2026-01-23 | 90.9 % |
| 2026-01-30 | 90.5 % |
| 2026-02-06 | 89.4 % |
| 2026-02-13 | 91.0 % |
| 2026-02-20 | 88.6 % |
| 2026-02-27 | 89.2 % |
| 2026-03-06 | 90.8 % |
| 2026-03-13 | 91.4 % |
| 2026-03-20 | 92.9 % |
| 2026-03-27 | 92.1 % |
| 2026-04-03 | 92.0 % |
| 2026-04-10 | 89.6 % |
| 2026-04-17 | 89.1 % |
| 2026-04-24 | 89.6 % |
| 2026-05-01 | 90.1 % |
| 2026-05-08 | 91.7 % |
| 2026-05-15 | 91.6 % |
| 2026-05-22 | 94.5 % |
| 2026-05-29 | 94.7 % |
| 2026-06-05 | 95.3 % |
| 2026-06-12 | 96.7 % |
| 2026-06-19 | 96.1 % |
| 2026-06-26 | 96.6 % |
| 2026-07-03 | 95.8 % |
| 2026-07-10 | 96.2 % |
| 2026-07-17 | 96.1 % |
| 2026-07-24 | 97.2 % |
| 2026-07-31 | 96.5 % |
| 2026-08-07 | 96.2 % |
| 2026-08-14 | 97.2 % |
| 2026-08-21 | 97.4 % |
| 2026-08-28 | 98.0 % |
| 2026-09-04 | 97.8 % |
| 2026-09-11 | 96.8 % |
| 2026-09-18 | 94.0 % |
| 2026-09-25 | 92.5 % |
| 2026-10-02 | 92.7 % |
| 2026-10-09 | 93.5 % |
| 2026-10-16 | 93.4 % |
Latest observation comparisons
2026-10-16: 93.4 %
52-week comparison
+4.8 percentage points
Compared with 2025-10-17: 88.6 %.
Seasonal context
+4.8 percentage points
Compared with the same-season median of 5 available prior years: 88.6 %.
Historical range: 84.7 % to 89.5 %.
Compare seasons — 2026 / 2025
Calendar-year comparison. 2026 data through 2026-10-16; later positions contain historical context only.
- 2026
- 2025
- Range of 3–5 prior years
%
Point to the chart, or focus it and use the arrow keys, to compare a seasonal week. Home and End reach the first and last positions.
Weekly positions follow the latest observation’s weekday. Each year uses its nearest recorded observation within 3 days of that calendar date, within the same year. February 29 maps to February 28 in other years. Missing weeks break the lines and range; values are not filled in.
The shaded range uses the lowest and highest matched observations from the previous 5 calendar years, with at least 3 years at each position. Coverage can vary by week. This is historical context, not a forecast.
Seasonal dates & values
| Seasonal position | 2026 | 2025 | Historical range |
|---|---|---|---|
| 2026-01-02 | 2026-01-02: 94.7 % | 2025-01-03: 93.3 % | Low 80.7 % (2021-01-01); high 93.3 % (2025-01-03). 3 years: 2025, 2024, 2021. |
| 2026-01-09 | 2026-01-09: 95.3 % | 2025-01-10: 91.7 % | Low 82.0 % (2021-01-08); high 92.6 % (2024-01-12). 5 years: 2025, 2024, 2023, 2022, 2021. |
| 2026-01-16 | 2026-01-16: 93.3 % | 2025-01-17: 85.9 % | Low 82.5 % (2021-01-15); high 88.1 % (2022-01-14). 5 years: 2025, 2024, 2023, 2022, 2021. |
| 2026-01-23 | 2026-01-23: 90.9 % | 2025-01-24: 83.5 % | Low 81.7 % (2021-01-22); high 87.7 % (2022-01-21). 5 years: 2025, 2024, 2023, 2022, 2021. |
| 2026-01-30 | 2026-01-30: 90.5 % | 2025-01-31: 84.5 % | Low 82.3 % (2021-01-29); high 86.7 % (2022-01-28). 5 years: 2025, 2024, 2023, 2022, 2021. |
| 2026-02-06 | 2026-02-06: 89.4 % | 2025-02-07: 85.0 % | Low 80.6 % (2024-02-09); high 88.2 % (2022-02-04). 5 years: 2025, 2024, 2023, 2022, 2021. |
| 2026-02-13 | 2026-02-13: 91.0 % | 2025-02-14: 84.9 % | Low 80.6 % (2024-02-16); high 86.5 % (2023-02-10). 5 years: 2025, 2024, 2023, 2022, 2021. |
| 2026-02-20 | 2026-02-20: 88.6 % | 2025-02-21: 86.5 % | Low 68.6 % (2021-02-19); high 87.4 % (2022-02-18). 5 years: 2025, 2024, 2023, 2022, 2021. |
| 2026-02-27 | 2026-02-27: 89.2 % | 2025-02-28: 85.9 % | Low 56.0 % (2021-02-26); high 87.7 % (2022-02-25). 5 years: 2025, 2024, 2023, 2022, 2021. |
| 2026-03-06 | 2026-03-06: 90.8 % | 2025-03-07: 86.5 % | Low 69.0 % (2021-03-05); high 89.3 % (2022-03-04). 5 years: 2025, 2024, 2023, 2022, 2021. |
| 2026-03-13 | 2026-03-13: 91.4 % | 2025-03-14: 86.9 % | Low 76.1 % (2021-03-12); high 90.4 % (2022-03-11). 5 years: 2025, 2024, 2023, 2022, 2021. |
| 2026-03-20 | 2026-03-20: 92.9 % | 2025-03-21: 87.0 % | Low 81.6 % (2021-03-19); high 91.1 % (2022-03-18). 5 years: 2025, 2024, 2023, 2022, 2021. |
| 2026-03-27 | 2026-03-27: 92.1 % | 2025-03-28: 86.0 % | Low 83.9 % (2021-03-26); high 92.1 % (2022-03-25). 5 years: 2025, 2024, 2023, 2022, 2021. |
| 2026-04-03 | 2026-04-03: 92.0 % | 2025-04-04: 86.7 % | Low 84.0 % (2021-04-02); high 92.5 % (2022-04-01). 5 years: 2025, 2024, 2023, 2022, 2021. |
| 2026-04-10 | 2026-04-10: 89.6 % | 2025-04-11: 86.3 % | Low 85.0 % (2021-04-09); high 90.0 % (2022-04-08). 5 years: 2025, 2024, 2023, 2022, 2021. |
| 2026-04-17 | 2026-04-17: 89.1 % | 2025-04-18: 88.1 % | Low 85.0 % (2021-04-16); high 91.0 % (2023-04-14). 5 years: 2025, 2024, 2023, 2022, 2021. |
| 2026-04-24 | 2026-04-24: 89.6 % | 2025-04-25: 88.6 % | Low 85.4 % (2021-04-23); high 91.3 % (2023-04-21). 5 years: 2025, 2024, 2023, 2022, 2021. |
| 2026-05-01 | 2026-05-01: 90.1 % | 2025-05-02: 89.0 % | Low 86.5 % (2021-04-30); high 90.7 % (2023-04-28). 5 years: 2025, 2024, 2023, 2022, 2021. |
| 2026-05-08 | 2026-05-08: 91.7 % | 2025-05-09: 90.2 % | Low 86.1 % (2021-05-07); high 91.0 % (2023-05-05). 5 years: 2025, 2024, 2023, 2022, 2021. |
| 2026-05-15 | 2026-05-15: 91.6 % | 2025-05-16: 90.7 % | Low 86.3 % (2021-05-14); high 92.0 % (2023-05-12). 5 years: 2025, 2024, 2023, 2022, 2021. |
| 2026-05-22 | 2026-05-22: 94.5 % | 2025-05-23: 90.2 % | Low 87.0 % (2021-05-21); high 94.3 % (2024-05-24). 5 years: 2025, 2024, 2023, 2022, 2021. |
| 2026-05-29 | 2026-05-29: 94.7 % | 2025-05-30: 93.4 % | Low 88.7 % (2021-05-28); high 95.4 % (2024-05-31). 5 years: 2025, 2024, 2023, 2022, 2021. |
| 2026-06-05 | 2026-06-05: 95.3 % | 2025-06-06: 94.3 % | Low 91.3 % (2021-06-04); high 95.8 % (2023-06-02). 5 years: 2025, 2024, 2023, 2022, 2021. |
| 2026-06-12 | 2026-06-12: 96.7 % | 2025-06-13: 93.2 % | Low 92.6 % (2021-06-11); high 93.7 % (2023-06-09). 5 years: 2025, 2024, 2023, 2022, 2021. |
| 2026-06-19 | 2026-06-19: 96.1 % | 2025-06-20: 94.7 % | Low 92.2 % (2024-06-21); high 94.7 % (2025-06-20). 5 years: 2025, 2024, 2023, 2022, 2021. |
| 2026-06-26 | 2026-06-26: 96.6 % | 2025-06-27: 94.9 % | Low 92.2 % (2023-06-23); high 95.0 % (2022-06-24). 5 years: 2025, 2024, 2023, 2022, 2021. |
| 2026-07-03 | 2026-07-03: 95.8 % | 2025-07-04: 94.7 % | Low 91.1 % (2023-06-30); high 95.4 % (2024-07-05). 5 years: 2025, 2024, 2023, 2022, 2021. |
| 2026-07-10 | 2026-07-10: 96.2 % | 2025-07-11: 93.9 % | Low 91.8 % (2021-07-09); high 94.9 % (2022-07-08). 5 years: 2025, 2024, 2023, 2022, 2021. |
| 2026-07-17 | 2026-07-17: 96.1 % | 2025-07-18: 95.5 % | Low 91.4 % (2021-07-16); high 95.5 % (2025-07-18). 5 years: 2025, 2024, 2023, 2022, 2021. |
| 2026-07-24 | 2026-07-24: 97.2 % | 2025-07-25: 95.4 % | Low 90.1 % (2024-07-26); high 95.4 % (2025-07-25). 5 years: 2025, 2024, 2023, 2022, 2021. |
| 2026-07-31 | 2026-07-31: 96.5 % | 2025-08-01: 96.9 % | Low 90.5 % (2024-08-02); high 96.9 % (2025-08-01). 5 years: 2025, 2024, 2023, 2022, 2021. |
| 2026-08-07 | 2026-08-07: 96.2 % | 2025-08-08: 96.4 % | Low 91.5 % (2024-08-09); high 96.4 % (2025-08-08). 5 years: 2025, 2024, 2023, 2022, 2021. |
| 2026-08-14 | 2026-08-14: 97.2 % | 2025-08-15: 96.6 % | Low 92.2 % (2021-08-13); high 96.6 % (2025-08-15). 5 years: 2025, 2024, 2023, 2022, 2021. |
| 2026-08-21 | 2026-08-21: 97.4 % | 2025-08-22: 94.6 % | Low 92.4 % (2021-08-20); high 94.6 % (2025-08-22). 5 years: 2025, 2024, 2023, 2022, 2021. |
| 2026-08-28 | 2026-08-28: 98.0 % | 2025-08-29: 94.3 % | Low 91.3 % (2021-08-27); high 94.3 % (2025-08-29). 5 years: 2025, 2024, 2023, 2022, 2021. |
| 2026-09-04 | 2026-09-04: 97.8 % | 2025-09-05: 94.9 % | Low 81.9 % (2021-09-03); high 94.9 % (2025-09-05). 5 years: 2025, 2024, 2023, 2022, 2021. |
| 2026-09-11 | 2026-09-11: 96.8 % | 2025-09-12: 93.3 % | Low 82.1 % (2021-09-10); high 93.7 % (2023-09-08). 5 years: 2025, 2024, 2023, 2022, 2021. |
| 2026-09-18 | 2026-09-18: 94.0 % | 2025-09-19: 93.0 % | Low 87.5 % (2021-09-17); high 93.6 % (2022-09-16). 5 years: 2025, 2024, 2023, 2022, 2021. |
| 2026-09-25 | 2026-09-25: 92.5 % | 2025-09-26: 91.4 % | Low 87.6 % (2024-09-27); high 91.4 % (2025-09-26). 5 years: 2025, 2024, 2023, 2022, 2021. |
| 2026-10-02 | 2026-10-02: 92.7 % | 2025-10-03: 92.4 % | Low 86.7 % (2024-10-04); high 92.4 % (2025-10-03). 5 years: 2025, 2024, 2023, 2022, 2021. |
| 2026-10-09 | 2026-10-09: 93.5 % | 2025-10-10: 85.7 % | Low 85.7 % (2025-10-10); high 89.9 % (2022-10-07). 5 years: 2025, 2024, 2023, 2022, 2021. |
| 2026-10-16 | 2026-10-16: 93.4 % | 2025-10-17: 88.6 % | Low 84.7 % (2021-10-15); high 89.5 % (2024-10-18). 5 years: 2025, 2024, 2023, 2022, 2021. |
| 2026-10-23 | Unavailable | 2025-10-24: 86.6 % | Low 85.1 % (2021-10-22); high 89.1 % (2024-10-25). 5 years: 2025, 2024, 2023, 2022, 2021. |
| 2026-10-30 | Unavailable | 2025-10-31: 86.0 % | Low 85.4 % (2023-10-27); high 90.6 % (2022-10-28). 5 years: 2025, 2024, 2023, 2022, 2021. |
| 2026-11-06 | Unavailable | 2025-11-07: 89.4 % | Low 85.2 % (2023-11-03); high 92.1 % (2022-11-04). 5 years: 2025, 2024, 2023, 2022, 2021. |
| 2026-11-13 | Unavailable | 2025-11-14: 90.0 % | Low 86.1 % (2023-11-10); high 92.9 % (2022-11-11). 5 years: 2025, 2024, 2023, 2022, 2021. |
| 2026-11-20 | Unavailable | 2025-11-21: 92.3 % | Low 87.0 % (2023-11-17); high 93.9 % (2022-11-18). 5 years: 2025, 2024, 2023, 2022, 2021. |
| 2026-11-27 | Unavailable | 2025-11-28: 94.1 % | Low 88.8 % (2021-11-26); high 95.2 % (2022-11-25). 5 years: 2025, 2024, 2023, 2022, 2021. |
| 2026-12-04 | Unavailable | 2025-12-05: 94.5 % | Low 89.8 % (2021-12-03); high 95.5 % (2022-12-02). 5 years: 2025, 2024, 2023, 2022, 2021. |
| 2026-12-11 | Unavailable | 2025-12-12: 94.8 % | Low 89.8 % (2021-12-10); high 94.8 % (2025-12-12). 5 years: 2025, 2024, 2023, 2022, 2021. |
| 2026-12-18 | Unavailable | 2025-12-19: 94.6 % | Low 89.6 % (2021-12-17); high 94.6 % (2025-12-19). 5 years: 2025, 2024, 2023, 2022, 2021. |
| 2026-12-25 | Unavailable | 2025-12-26: 94.7 % | Low 89.7 % (2021-12-24); high 94.7 % (2025-12-26). 5 years: 2025, 2024, 2023, 2022, 2021. |
Comparison dates & method
Comparisons use the latest observation above and stay the same when you change the chart period. They use the provider values currently held in the local history, including available revisions.
The 52-week comparison uses an observation within 3 days of the date 364 days earlier. Actual comparison dates are shown above.
Seasonal context uses one observation within 3 days of the same calendar date in each of the previous 5 years, where available. At least 3 years are required. The displayed range describes those observations; it is not a forecast or a full-year high/low.
| Observation date | Value |
|---|---|
| 2025-10-17 | 88.6 % |
| 2024-10-18 | 89.5 % |
| 2023-10-13 | 86.1 % |
| 2022-10-14 | 89.5 % |
| 2021-10-15 | 84.7 % |
U.S. end-of-week propane and propylene stocks excluding propylene held at terminals; this combined series is not solely ready-for-sale propane.
History & comparisons — U.S. Propane / Propylene Stocks Seasonal chart available
2025-10-10 – 2026-10-16 · 54 observations
million bbl
Point to the chart, or focus it and use the left and right arrow keys, to inspect recorded values.
Available history only. Lines connect recorded observations; values between them are not supplied.
Recorded values
| Observation date | Value (million bbl) |
|---|---|
| 2025-10-10 | 102.376 million bbl |
| 2025-10-17 | 103.175 million bbl |
| 2025-10-24 | 105.681 million bbl |
| 2025-10-31 | 106.094 million bbl |
| 2025-11-07 | 105.403 million bbl |
| 2025-11-14 | 105.361 million bbl |
| 2025-11-21 | 104.233 million bbl |
| 2025-11-28 | 103.546 million bbl |
| 2025-12-05 | 101.770 million bbl |
| 2025-12-12 | 99.998 million bbl |
| 2025-12-19 | 99.539 million bbl |
| 2025-12-26 | 100.324 million bbl |
| 2026-01-02 | 98.104 million bbl |
| 2026-01-09 | 95.714 million bbl |
| 2026-01-16 | 93.640 million bbl |
| 2026-01-23 | 88.952 million bbl |
| 2026-01-30 | 82.716 million bbl |
| 2026-02-06 | 77.269 million bbl |
| 2026-02-13 | 74.185 million bbl |
| 2026-02-20 | 72.532 million bbl |
| 2026-02-27 | 73.351 million bbl |
| 2026-03-06 | 71.675 million bbl |
| 2026-03-13 | 72.485 million bbl |
| 2026-03-20 | 72.963 million bbl |
| 2026-03-27 | 77.026 million bbl |
| 2026-04-03 | 77.596 million bbl |
| 2026-04-10 | 77.897 million bbl |
| 2026-04-17 | 79.990 million bbl |
| 2026-04-24 | 78.846 million bbl |
| 2026-05-01 | 77.556 million bbl |
| 2026-05-08 | 81.146 million bbl |
| 2026-05-15 | 81.567 million bbl |
| 2026-05-22 | 81.185 million bbl |
| 2026-05-29 | 83.316 million bbl |
| 2026-06-05 | 84.460 million bbl |
| 2026-06-12 | 87.429 million bbl |
| 2026-06-19 | 90.047 million bbl |
| 2026-06-26 | 91.306 million bbl |
| 2026-07-03 | 90.461 million bbl |
| 2026-07-10 | 93.489 million bbl |
| 2026-07-17 | 99.776 million bbl |
| 2026-07-24 | 102.286 million bbl |
| 2026-07-31 | 103.103 million bbl |
| 2026-08-07 | 104.974 million bbl |
| 2026-08-14 | 107.013 million bbl |
| 2026-08-21 | 109.483 million bbl |
| 2026-08-28 | 107.411 million bbl |
| 2026-09-04 | 110.470 million bbl |
| 2026-09-11 | 109.092 million bbl |
| 2026-09-18 | 107.870 million bbl |
| 2026-09-25 | 109.647 million bbl |
| 2026-10-02 | 107.846 million bbl |
| 2026-10-09 | 106.375 million bbl |
| 2026-10-16 | 105.846 million bbl |
Latest observation comparisons
2026-10-16: 105.846 million bbl
52-week comparison
+2.671 million bbl (+2.6%)
Compared with 2025-10-17: 103.175 million bbl.
Seasonal context
+4.080 million bbl (+4.0%)
Compared with the same-season median of 5 available prior years: 101.766 million bbl.
Historical range: 73.620 million bbl to 103.175 million bbl.
Compare seasons — 2026 / 2025
Calendar-year comparison. 2026 data through 2026-10-16; later positions contain historical context only.
- 2026
- 2025
- Range of 3–5 prior years
million bbl
Point to the chart, or focus it and use the arrow keys, to compare a seasonal week. Home and End reach the first and last positions.
Weekly positions follow the latest observation’s weekday. Each year uses its nearest recorded observation within 3 days of that calendar date, within the same year. February 29 maps to February 28 in other years. Missing weeks break the lines and range; values are not filled in.
The shaded range uses the lowest and highest matched observations from the previous 5 calendar years, with at least 3 years at each position. Coverage can vary by week. This is historical context, not a forecast.
Seasonal dates & values
| Seasonal position | 2026 | 2025 | Historical range |
|---|---|---|---|
| 2026-01-02 | 2026-01-02: 98.104 million bbl | 2025-01-03: 82.588 million bbl | Low 72.777 million bbl (2021-01-01); high 82.588 million bbl (2025-01-03). 3 years: 2025, 2024, 2021. |
| 2026-01-09 | 2026-01-09: 95.714 million bbl | 2025-01-10: 77.851 million bbl | Low 62.379 million bbl (2022-01-07); high 78.587 million bbl (2023-01-06). 5 years: 2025, 2024, 2023, 2022, 2021. |
| 2026-01-16 | 2026-01-16: 93.640 million bbl | 2025-01-17: 74.135 million bbl | Low 58.686 million bbl (2022-01-14); high 76.619 million bbl (2023-01-13). 5 years: 2025, 2024, 2023, 2022, 2021. |
| 2026-01-23 | 2026-01-23: 88.952 million bbl | 2025-01-24: 66.249 million bbl | Low 54.076 million bbl (2022-01-21); high 75.618 million bbl (2023-01-20). 5 years: 2025, 2024, 2023, 2022, 2021. |
| 2026-01-30 | 2026-01-30: 82.716 million bbl | 2025-01-31: 61.429 million bbl | Low 49.752 million bbl (2022-01-28); high 73.181 million bbl (2023-01-27). 5 years: 2025, 2024, 2023, 2022, 2021. |
| 2026-02-06 | 2026-02-06: 77.269 million bbl | 2025-02-07: 58.858 million bbl | Low 47.838 million bbl (2022-02-04); high 68.874 million bbl (2023-02-03). 5 years: 2025, 2024, 2023, 2022, 2021. |
| 2026-02-13 | 2026-02-13: 74.185 million bbl | 2025-02-14: 55.268 million bbl | Low 41.903 million bbl (2022-02-11); high 66.297 million bbl (2023-02-10). 5 years: 2025, 2024, 2023, 2022, 2021. |
| 2026-02-20 | 2026-02-20: 72.532 million bbl | 2025-02-21: 51.546 million bbl | Low 38.002 million bbl (2022-02-18); high 63.336 million bbl (2023-02-17). 5 years: 2025, 2024, 2023, 2022, 2021. |
| 2026-02-27 | 2026-02-27: 73.351 million bbl | 2025-02-28: 48.654 million bbl | Low 37.154 million bbl (2022-02-25); high 60.590 million bbl (2023-02-24). 5 years: 2025, 2024, 2023, 2022, 2021. |
| 2026-03-06 | 2026-03-06: 71.675 million bbl | 2025-03-07: 45.259 million bbl | Low 35.530 million bbl (2022-03-04); high 60.053 million bbl (2023-03-03). 5 years: 2025, 2024, 2023, 2022, 2021. |
| 2026-03-13 | 2026-03-13: 72.485 million bbl | 2025-03-14: 43.349 million bbl | Low 33.308 million bbl (2022-03-11); high 60.970 million bbl (2023-03-10). 5 years: 2025, 2024, 2023, 2022, 2021. |
| 2026-03-20 | 2026-03-20: 72.963 million bbl | 2025-03-21: 43.159 million bbl | Low 33.564 million bbl (2022-03-18); high 58.703 million bbl (2023-03-17). 5 years: 2025, 2024, 2023, 2022, 2021. |
| 2026-03-27 | 2026-03-27: 77.026 million bbl | 2025-03-28: 44.141 million bbl | Low 33.709 million bbl (2022-03-25); high 56.243 million bbl (2023-03-24). 5 years: 2025, 2024, 2023, 2022, 2021. |
| 2026-04-03 | 2026-04-03: 77.596 million bbl | 2025-04-04: 45.651 million bbl | Low 34.375 million bbl (2022-04-01); high 55.708 million bbl (2023-03-31). 5 years: 2025, 2024, 2023, 2022, 2021. |
| 2026-04-10 | 2026-04-10: 77.897 million bbl | 2025-04-11: 44.367 million bbl | Low 35.359 million bbl (2022-04-08); high 56.177 million bbl (2023-04-07). 5 years: 2025, 2024, 2023, 2022, 2021. |
| 2026-04-17 | 2026-04-17: 79.990 million bbl | 2025-04-18: 46.630 million bbl | Low 36.990 million bbl (2022-04-15); high 56.675 million bbl (2024-04-19). 5 years: 2025, 2024, 2023, 2022, 2021. |
| 2026-04-24 | 2026-04-24: 78.846 million bbl | 2025-04-25: 47.206 million bbl | Low 39.185 million bbl (2022-04-22); high 58.889 million bbl (2023-04-21). 5 years: 2025, 2024, 2023, 2022, 2021. |
| 2026-05-01 | 2026-05-01: 77.556 million bbl | 2025-05-02: 48.176 million bbl | Low 40.810 million bbl (2022-04-29); high 59.092 million bbl (2024-05-03). 5 years: 2025, 2024, 2023, 2022, 2021. |
| 2026-05-08 | 2026-05-08: 81.146 million bbl | 2025-05-09: 50.424 million bbl | Low 44.012 million bbl (2021-05-07); high 61.967 million bbl (2024-05-10). 5 years: 2025, 2024, 2023, 2022, 2021. |
| 2026-05-15 | 2026-05-15: 81.567 million bbl | 2025-05-16: 53.099 million bbl | Low 44.426 million bbl (2021-05-14); high 64.215 million bbl (2024-05-17). 5 years: 2025, 2024, 2023, 2022, 2021. |
| 2026-05-22 | 2026-05-22: 81.185 million bbl | 2025-05-23: 55.099 million bbl | Low 44.067 million bbl (2021-05-21); high 66.714 million bbl (2023-05-19). 5 years: 2025, 2024, 2023, 2022, 2021. |
| 2026-05-29 | 2026-05-29: 83.316 million bbl | 2025-05-30: 61.943 million bbl | Low 48.151 million bbl (2021-05-28); high 70.671 million bbl (2023-05-26). 5 years: 2025, 2024, 2023, 2022, 2021. |
| 2026-06-05 | 2026-06-05: 84.460 million bbl | 2025-06-06: 65.986 million bbl | Low 50.233 million bbl (2022-06-03); high 72.342 million bbl (2023-06-02). 5 years: 2025, 2024, 2023, 2022, 2021. |
| 2026-06-12 | 2026-06-12: 87.429 million bbl | 2025-06-13: 67.523 million bbl | Low 51.821 million bbl (2022-06-10); high 75.461 million bbl (2023-06-09). 5 years: 2025, 2024, 2023, 2022, 2021. |
| 2026-06-19 | 2026-06-19: 90.047 million bbl | 2025-06-20: 72.615 million bbl | Low 53.953 million bbl (2022-06-17); high 76.952 million bbl (2023-06-16). 5 years: 2025, 2024, 2023, 2022, 2021. |
| 2026-06-26 | 2026-06-26: 91.306 million bbl | 2025-06-27: 75.651 million bbl | Low 54.003 million bbl (2022-06-24); high 79.547 million bbl (2023-06-23). 5 years: 2025, 2024, 2023, 2022, 2021. |
| 2026-07-03 | 2026-07-03: 90.461 million bbl | 2025-07-04: 78.385 million bbl | Low 54.911 million bbl (2022-07-01); high 81.119 million bbl (2023-06-30). 5 years: 2025, 2024, 2023, 2022, 2021. |
| 2026-07-10 | 2026-07-10: 93.489 million bbl | 2025-07-11: 82.849 million bbl | Low 57.801 million bbl (2022-07-08); high 83.793 million bbl (2023-07-07). 5 years: 2025, 2024, 2023, 2022, 2021. |
| 2026-07-17 | 2026-07-17: 99.776 million bbl | 2025-07-18: 82.327 million bbl | Low 59.204 million bbl (2022-07-15); high 84.680 million bbl (2023-07-14). 5 years: 2025, 2024, 2023, 2022, 2021. |
| 2026-07-24 | 2026-07-24: 102.286 million bbl | 2025-07-25: 83.477 million bbl | Low 61.794 million bbl (2022-07-22); high 87.394 million bbl (2024-07-26). 5 years: 2025, 2024, 2023, 2022, 2021. |
| 2026-07-31 | 2026-07-31: 103.103 million bbl | 2025-08-01: 84.739 million bbl | Low 63.614 million bbl (2022-07-29); high 88.623 million bbl (2023-07-28). 5 years: 2025, 2024, 2023, 2022, 2021. |
| 2026-08-07 | 2026-08-07: 104.974 million bbl | 2025-08-08: 88.612 million bbl | Low 65.329 million bbl (2021-08-06); high 90.082 million bbl (2024-08-09). 5 years: 2025, 2024, 2023, 2022, 2021. |
| 2026-08-14 | 2026-08-14: 107.013 million bbl | 2025-08-15: 91.242 million bbl | Low 66.761 million bbl (2021-08-13); high 92.078 million bbl (2024-08-16). 5 years: 2025, 2024, 2023, 2022, 2021. |
| 2026-08-21 | 2026-08-21: 109.483 million bbl | 2025-08-22: 92.972 million bbl | Low 68.011 million bbl (2022-08-19); high 93.069 million bbl (2024-08-23). 5 years: 2025, 2024, 2023, 2022, 2021. |
| 2026-08-28 | 2026-08-28: 107.411 million bbl | 2025-08-29: 96.128 million bbl | Low 69.282 million bbl (2021-08-27); high 96.128 million bbl (2025-08-29). 5 years: 2025, 2024, 2023, 2022, 2021. |
| 2026-09-04 | 2026-09-04: 110.470 million bbl | 2025-09-05: 97.634 million bbl | Low 70.099 million bbl (2021-09-03); high 97.634 million bbl (2025-09-05). 5 years: 2025, 2024, 2023, 2022, 2021. |
| 2026-09-11 | 2026-09-11: 109.092 million bbl | 2025-09-12: 98.931 million bbl | Low 70.816 million bbl (2021-09-10); high 99.113 million bbl (2023-09-08). 5 years: 2025, 2024, 2023, 2022, 2021. |
| 2026-09-18 | 2026-09-18: 107.870 million bbl | 2025-09-19: 99.918 million bbl | Low 70.279 million bbl (2021-09-17); high 100.702 million bbl (2023-09-15). 5 years: 2025, 2024, 2023, 2022, 2021. |
| 2026-09-25 | 2026-09-25: 109.647 million bbl | 2025-09-26: 103.376 million bbl | Low 72.921 million bbl (2021-09-24); high 103.376 million bbl (2025-09-26). 5 years: 2025, 2024, 2023, 2022, 2021. |
| 2026-10-02 | 2026-10-02: 107.846 million bbl | 2025-10-03: 100.501 million bbl | Low 72.288 million bbl (2021-10-01); high 101.408 million bbl (2023-09-29). 5 years: 2025, 2024, 2023, 2022, 2021. |
| 2026-10-09 | 2026-10-09: 106.375 million bbl | 2025-10-10: 102.376 million bbl | Low 71.700 million bbl (2021-10-08); high 103.135 million bbl (2024-10-11). 5 years: 2025, 2024, 2023, 2022, 2021. |
| 2026-10-16 | 2026-10-16: 105.846 million bbl | 2025-10-17: 103.175 million bbl | Low 73.620 million bbl (2021-10-15); high 103.175 million bbl (2025-10-17). 5 years: 2025, 2024, 2023, 2022, 2021. |
| 2026-10-23 | Unavailable | 2025-10-24: 105.681 million bbl | Low 75.666 million bbl (2021-10-22); high 105.681 million bbl (2025-10-24). 5 years: 2025, 2024, 2023, 2022, 2021. |
| 2026-10-30 | Unavailable | 2025-10-31: 106.094 million bbl | Low 76.098 million bbl (2021-10-29); high 106.094 million bbl (2025-10-31). 5 years: 2025, 2024, 2023, 2022, 2021. |
| 2026-11-06 | Unavailable | 2025-11-07: 105.403 million bbl | Low 74.757 million bbl (2021-11-05); high 105.403 million bbl (2025-11-07). 5 years: 2025, 2024, 2023, 2022, 2021. |
| 2026-11-13 | Unavailable | 2025-11-14: 105.361 million bbl | Low 74.568 million bbl (2021-11-12); high 105.361 million bbl (2025-11-14). 5 years: 2025, 2024, 2023, 2022, 2021. |
| 2026-11-20 | Unavailable | 2025-11-21: 104.233 million bbl | Low 73.612 million bbl (2021-11-19); high 104.233 million bbl (2025-11-21). 5 years: 2025, 2024, 2023, 2022, 2021. |
| 2026-11-27 | Unavailable | 2025-11-28: 103.546 million bbl | Low 72.660 million bbl (2021-11-26); high 103.546 million bbl (2025-11-28). 5 years: 2025, 2024, 2023, 2022, 2021. |
| 2026-12-04 | Unavailable | 2025-12-05: 101.770 million bbl | Low 73.272 million bbl (2021-12-03); high 101.770 million bbl (2025-12-05). 5 years: 2025, 2024, 2023, 2022, 2021. |
| 2026-12-11 | Unavailable | 2025-12-12: 99.998 million bbl | Low 70.872 million bbl (2021-12-10); high 99.998 million bbl (2025-12-12). 5 years: 2025, 2024, 2023, 2022, 2021. |
| 2026-12-18 | Unavailable | 2025-12-19: 99.539 million bbl | Low 70.023 million bbl (2021-12-17); high 99.539 million bbl (2025-12-19). 5 years: 2025, 2024, 2023, 2022, 2021. |
| 2026-12-25 | Unavailable | 2025-12-26: 100.324 million bbl | Low 66.464 million bbl (2021-12-24); high 100.324 million bbl (2025-12-26). 5 years: 2025, 2024, 2023, 2022, 2021. |
Comparison dates & method
Comparisons use the latest observation above and stay the same when you change the chart period. They use the provider values currently held in the local history, including available revisions.
The 52-week comparison uses an observation within 3 days of the date 364 days earlier. Actual comparison dates are shown above.
Seasonal context uses one observation within 3 days of the same calendar date in each of the previous 5 years, where available. At least 3 years are required. The displayed range describes those observations; it is not a forecast or a full-year high/low.
| Observation date | Value |
|---|---|
| 2025-10-17 | 103.175 million bbl |
| 2024-10-18 | 101.766 million bbl |
| 2023-10-13 | 102.320 million bbl |
| 2022-10-14 | 85.964 million bbl |
| 2021-10-15 | 73.620 million bbl |
Petroleum rail activity
Weekly petroleum carloads originated by BNSF and Union Pacific, including crude oil and refined products. Compare each railroad with its own history; counts are not gallons or a national total.
Weekly petroleum-products carloads originated by this railroad; the category includes crude oil and refining products. Received interchange carloads are excluded. Selected carrier coverage, not national tonnage or truck demand.
History & comparisons — BNSF · Petroleum-products carloads originated
2025-10-11 – 2026-10-17 · 54 observations
carloads
Point to the chart, or focus it and use the left and right arrow keys, to inspect recorded values.
Available history only. Lines connect recorded observations; values between them are not supplied.
Recorded values
| Observation date | Value (carloads) |
|---|---|
| 2025-10-11 | 5,107 carloads |
| 2025-10-18 | 5,148 carloads |
| 2025-10-25 | 5,020 carloads |
| 2025-11-01 | 5,273 carloads |
| 2025-11-08 | 5,393 carloads |
| 2025-11-15 | 4,749 carloads |
| 2025-11-22 | 5,092 carloads |
| 2025-11-29 | 4,501 carloads |
| 2025-12-06 | 5,715 carloads |
| 2025-12-13 | 4,787 carloads |
| 2025-12-20 | 4,644 carloads |
| 2025-12-27 | 4,547 carloads |
| 2026-01-03 | 4,541 carloads |
| 2026-01-10 | 5,366 carloads |
| 2026-01-17 | 4,568 carloads |
| 2026-01-24 | 4,310 carloads |
| 2026-01-31 | 4,864 carloads |
| 2026-02-07 | 4,908 carloads |
| 2026-02-14 | 5,224 carloads |
| 2026-02-21 | 5,057 carloads |
| 2026-02-28 | 5,480 carloads |
| 2026-03-07 | 5,197 carloads |
| 2026-03-14 | 5,207 carloads |
| 2026-03-21 | 4,431 carloads |
| 2026-03-28 | 5,400 carloads |
| 2026-04-04 | 5,523 carloads |
| 2026-04-11 | 4,867 carloads |
| 2026-04-18 | 5,186 carloads |
| 2026-04-25 | 4,802 carloads |
| 2026-05-02 | 4,924 carloads |
| 2026-05-09 | 5,593 carloads |
| 2026-05-16 | 5,374 carloads |
| 2026-05-23 | 5,142 carloads |
| 2026-05-30 | 5,260 carloads |
| 2026-06-06 | 5,451 carloads |
| 2026-06-13 | 5,053 carloads |
| 2026-06-20 | 5,883 carloads |
| 2026-06-27 | 5,304 carloads |
| 2026-07-04 | 5,645 carloads |
| 2026-07-11 | 5,870 carloads |
| 2026-07-18 | 5,467 carloads |
| 2026-07-25 | 5,675 carloads |
| 2026-08-01 | 5,632 carloads |
| 2026-08-08 | 5,416 carloads |
| 2026-08-15 | 5,224 carloads |
| 2026-08-22 | 5,445 carloads |
| 2026-08-29 | 5,712 carloads |
| 2026-09-05 | 5,128 carloads |
| 2026-09-12 | 5,431 carloads |
| 2026-09-19 | 5,947 carloads |
| 2026-09-26 | 5,250 carloads |
| 2026-10-03 | 5,753 carloads |
| 2026-10-10 | 5,708 carloads |
| 2026-10-17 | 5,675 carloads |
Latest observation comparisons
2026-10-17: 5,675 carloads
52-week comparison
+527 carloads (+10.2%)
Compared with 2025-10-18: 5,148 carloads.
Comparison dates & method
Comparisons use the latest observation above and stay the same when you change the chart period. They use the provider values currently held in the local history, including available revisions.
The 52-week comparison uses an observation within 3 days of the date 364 days earlier. Actual comparison dates are shown above.
Weekly petroleum-products carloads originated by this railroad; the category includes crude oil and refining products. Received interchange carloads are excluded. Selected carrier coverage, not national tonnage or truck demand.
History & comparisons — Union Pacific · Petroleum-products carloads originated
2025-10-11 – 2026-10-17 · 54 observations
carloads
Point to the chart, or focus it and use the left and right arrow keys, to inspect recorded values.
Available history only. Lines connect recorded observations; values between them are not supplied.
Recorded values
| Observation date | Value (carloads) |
|---|---|
| 2025-10-11 | 3,504 carloads |
| 2025-10-18 | 3,274 carloads |
| 2025-10-25 | 2,958 carloads |
| 2025-11-01 | 3,390 carloads |
| 2025-11-08 | 3,313 carloads |
| 2025-11-15 | 3,386 carloads |
| 2025-11-22 | 3,220 carloads |
| 2025-11-29 | 2,828 carloads |
| 2025-12-06 | 3,403 carloads |
| 2025-12-13 | 3,655 carloads |
| 2025-12-20 | 3,490 carloads |
| 2025-12-27 | 2,766 carloads |
| 2026-01-03 | 3,397 carloads |
| 2026-01-10 | 3,886 carloads |
| 2026-01-17 | 3,670 carloads |
| 2026-01-24 | 3,773 carloads |
| 2026-01-31 | 3,642 carloads |
| 2026-02-07 | 3,754 carloads |
| 2026-02-14 | 3,511 carloads |
| 2026-02-21 | 3,699 carloads |
| 2026-02-28 | 4,053 carloads |
| 2026-03-07 | 3,394 carloads |
| 2026-03-14 | 3,446 carloads |
| 2026-03-21 | 3,775 carloads |
| 2026-03-28 | 3,676 carloads |
| 2026-04-04 | 3,150 carloads |
| 2026-04-11 | 3,716 carloads |
| 2026-04-18 | 3,609 carloads |
| 2026-04-25 | 3,476 carloads |
| 2026-05-02 | 3,619 carloads |
| 2026-05-09 | 3,567 carloads |
| 2026-05-16 | 3,601 carloads |
| 2026-05-23 | 3,584 carloads |
| 2026-05-30 | 3,019 carloads |
| 2026-06-06 | 3,551 carloads |
| 2026-06-13 | 3,775 carloads |
| 2026-06-20 | 3,586 carloads |
| 2026-06-27 | 3,170 carloads |
| 2026-07-04 | 3,295 carloads |
| 2026-07-11 | 3,719 carloads |
| 2026-07-18 | 3,277 carloads |
| 2026-07-25 | 3,615 carloads |
| 2026-08-01 | 3,489 carloads |
| 2026-08-08 | 3,665 carloads |
| 2026-08-15 | 3,685 carloads |
| 2026-08-22 | 3,753 carloads |
| 2026-08-29 | 3,351 carloads |
| 2026-09-05 | 3,832 carloads |
| 2026-09-12 | 3,281 carloads |
| 2026-09-19 | 3,803 carloads |
| 2026-09-26 | 3,764 carloads |
| 2026-10-03 | 3,897 carloads |
| 2026-10-10 | 4,002 carloads |
| 2026-10-17 | 3,829 carloads |
Latest observation comparisons
2026-10-17: 3,829 carloads
52-week comparison
+555 carloads (+17.0%)
Compared with 2025-10-18: 3,274 carloads.
Comparison dates & method
Comparisons use the latest observation above and stay the same when you change the chart period. They use the provider values currently held in the local history, including available revisions.
The 52-week comparison uses an observation within 3 days of the date 364 days earlier. Actual comparison dates are shown above.
Port of Los Angeles · Fuel receipts
Monthly liquid-bulk imports provide context for fuel receiving activity at this West Coast gateway.
Refined products (barge) imports
692,857 barrels
August 2026
-66.2% vs. August 2025
August 2025: 2,052,498 barrels
Gasoline imports
249,703 barrels
August 2026
-45.4% vs. August 2025
August 2025: 457,526 barrels
This report may be out of date. Check the source for its latest release.
Port of Los Angeles only; import classifications follow the port’s report. These are port receipts, not tank-truck loads, inland delivery demand or live congestion.
Source: Port of Los Angeles · monthly liquid bulk ↗ Year-ago source ↗
Fuel prices and refinery-related output provide supply and cost context. They do not establish tanker volumes, margins or renewable-fuel output.
What to watch: Refinery operations, terminal access, inventories, fuel specifications and regional supply shifts.
Related reporting

EPA Exempts 1.76 Billion RINs, Extends 2025 RFS Deadline to October 1
EPA granted 29 full or partial small-refinery exemptions and gave all obligated parties another month to reconcile 2025 RIN positions, without changing physical fuel…

Flatbed Strike Shuts Enbridge Line 5 as 31,000 Barrels of NGLs Vaporize
A parked subcontractor flatbed rolled into an excavation and struck Line 5, forcing a shutdown while Enbridge clears propane and butane vapors and works…

Tremcar Previews TremSmart Technology at NTTC Tank Truck Week
Tremcar will preview its TremSmart technology package on a petroleum tank trailer at Tank Truck Week, with PSI, RVS and Air-Weigh equipment and a…
Chemicals, Plastics & Fertilizer
Browse coverageLiquid chemicals, solvents, resins, plastic pellets and agricultural chemicals connect plant production with specialized bulk distribution.
History & comparisons — Basic Chemical Production
2025-08-01 – 2026-09-01 · 14 observations
index (2017=100)
Point to the chart, or focus it and use the left and right arrow keys, to inspect recorded values.
Available history only. Lines connect recorded observations; values between them are not supplied.
Recorded values
| Observation date | Value (index (2017=100)) |
|---|---|
| 2025-08-01 | 96.4 index (2017=100) |
| 2025-09-01 | 94.9 index (2017=100) |
| 2025-10-01 | 93.8 index (2017=100) |
| 2025-11-01 | 92.7 index (2017=100) |
| 2025-12-01 | 91.5 index (2017=100) |
| 2026-01-01 | 92.0 index (2017=100) |
| 2026-02-01 | 92.5 index (2017=100) |
| 2026-03-01 | 94.3 index (2017=100) |
| 2026-04-01 | 92.3 index (2017=100) |
| 2026-05-01 | 92.9 index (2017=100) |
| 2026-06-01 | 91.2 index (2017=100) |
| 2026-07-01 | 89.9 index (2017=100) |
| 2026-08-01 | 91.2 index (2017=100) |
| 2026-09-01 | 91.3 index (2017=100) |
Latest observation comparisons
2026-09-01: 91.3 index (2017=100)
Year-over-year
−3.6 index points (−3.8%)
Compared with 2025-09-01: 94.9 index (2017=100).
Comparison dates & method
Comparisons use the latest observation above and stay the same when you change the chart period. They use the provider values currently held in the local history, including available revisions.
The yearly comparison uses the same reporting month in the previous calendar year.
History & comparisons — Fertilizer & Agricultural Chemical Output
2025-08-01 – 2026-09-01 · 14 observations
index (2017=100)
Point to the chart, or focus it and use the left and right arrow keys, to inspect recorded values.
Available history only. Lines connect recorded observations; values between them are not supplied.
Recorded values
| Observation date | Value (index (2017=100)) |
|---|---|
| 2025-08-01 | 98.2 index (2017=100) |
| 2025-09-01 | 101.8 index (2017=100) |
| 2025-10-01 | 94.7 index (2017=100) |
| 2025-11-01 | 95.5 index (2017=100) |
| 2025-12-01 | 99.0 index (2017=100) |
| 2026-01-01 | 97.5 index (2017=100) |
| 2026-02-01 | 99.1 index (2017=100) |
| 2026-03-01 | 97.4 index (2017=100) |
| 2026-04-01 | 92.6 index (2017=100) |
| 2026-05-01 | 90.4 index (2017=100) |
| 2026-06-01 | 91.2 index (2017=100) |
| 2026-07-01 | 91.4 index (2017=100) |
| 2026-08-01 | 91.9 index (2017=100) |
| 2026-09-01 | 93.6 index (2017=100) |
Latest observation comparisons
2026-09-01: 93.6 index (2017=100)
Year-over-year
−8.2 index points (−8.1%)
Compared with 2025-09-01: 101.8 index (2017=100).
Comparison dates & method
Comparisons use the latest observation above and stay the same when you change the chart period. They use the provider values currently held in the local history, including available revisions.
The yearly comparison uses the same reporting month in the previous calendar year.
History & comparisons — Resin, Synthetic Rubber & Fiber Output
2025-08-01 – 2026-09-01 · 14 observations
index (2017=100)
Point to the chart, or focus it and use the left and right arrow keys, to inspect recorded values.
Available history only. Lines connect recorded observations; values between them are not supplied.
Recorded values
| Observation date | Value (index (2017=100)) |
|---|---|
| 2025-08-01 | 101.0 index (2017=100) |
| 2025-09-01 | 100.7 index (2017=100) |
| 2025-10-01 | 97.9 index (2017=100) |
| 2025-11-01 | 100.7 index (2017=100) |
| 2025-12-01 | 98.2 index (2017=100) |
| 2026-01-01 | 98.8 index (2017=100) |
| 2026-02-01 | 99.3 index (2017=100) |
| 2026-03-01 | 101.7 index (2017=100) |
| 2026-04-01 | 104.7 index (2017=100) |
| 2026-05-01 | 102.6 index (2017=100) |
| 2026-06-01 | 101.6 index (2017=100) |
| 2026-07-01 | 98.2 index (2017=100) |
| 2026-08-01 | 99.3 index (2017=100) |
| 2026-09-01 | 99.7 index (2017=100) |
Latest observation comparisons
2026-09-01: 99.7 index (2017=100)
Year-over-year
−0.9 index points (−0.9%)
Compared with 2025-09-01: 100.7 index (2017=100).
Comparison dates & method
Comparisons use the latest observation above and stay the same when you change the chart period. They use the provider values currently held in the local history, including available revisions.
The yearly comparison uses the same reporting month in the previous calendar year.
Chemical rail service
Loaded chemical railcars held for at least 48 hours. Compare each railroad with its own history; these service measures do not represent national volumes or truck demand.
Weekly average of daily loaded-car counts; the same car can recur. STCC 28 excludes separately reported ethanol and fertilizer.
History & comparisons — BNSF · Chemical cars held 48+ hours
2025-10-10 – 2026-10-16 · 54 observations
avg. cars
Point to the chart, or focus it and use the left and right arrow keys, to inspect recorded values.
Available history only. Lines connect recorded observations; values between them are not supplied.
Recorded values
| Observation date | Value (avg. cars) |
|---|---|
| 2025-10-10 | 173.7 avg. cars |
| 2025-10-17 | 188.7 avg. cars |
| 2025-10-24 | 194.7 avg. cars |
| 2025-10-31 | 212.7 avg. cars |
| 2025-11-07 | 200.1 avg. cars |
| 2025-11-14 | 177.9 avg. cars |
| 2025-11-21 | 167.9 avg. cars |
| 2025-11-28 | 165.1 avg. cars |
| 2025-12-05 | 175.4 avg. cars |
| 2025-12-12 | 183.3 avg. cars |
| 2025-12-19 | 180.7 avg. cars |
| 2025-12-26 | 257.7 avg. cars |
| 2026-01-02 | 320.0 avg. cars |
| 2026-01-09 | 281.4 avg. cars |
| 2026-01-16 | 202.0 avg. cars |
| 2026-01-23 | 252.6 avg. cars |
| 2026-01-30 | 355.6 avg. cars |
| 2026-02-06 | 327.6 avg. cars |
| 2026-02-13 | 194.0 avg. cars |
| 2026-02-20 | 200.0 avg. cars |
| 2026-02-27 | 187.9 avg. cars |
| 2026-03-06 | 290.4 avg. cars |
| 2026-03-13 | 216.7 avg. cars |
| 2026-03-20 | 221.0 avg. cars |
| 2026-03-27 | 216.1 avg. cars |
| 2026-04-03 | 221.7 avg. cars |
| 2026-04-10 | 218.7 avg. cars |
| 2026-04-17 | 205.0 avg. cars |
| 2026-04-24 | 200.9 avg. cars |
| 2026-05-01 | 164.1 avg. cars |
| 2026-05-08 | 237.1 avg. cars |
| 2026-05-15 | 185.1 avg. cars |
| 2026-05-22 | 204.3 avg. cars |
| 2026-05-29 | 220.7 avg. cars |
| 2026-06-05 | 205.6 avg. cars |
| 2026-06-12 | 181.9 avg. cars |
| 2026-06-19 | 173.0 avg. cars |
| 2026-06-26 | 213.4 avg. cars |
| 2026-07-03 | 197.3 avg. cars |
| 2026-07-10 | 300.3 avg. cars |
| 2026-07-17 | 242.7 avg. cars |
| 2026-07-24 | 256.0 avg. cars |
| 2026-07-31 | 248.3 avg. cars |
| 2026-08-07 | 273.0 avg. cars |
| 2026-08-14 | 241.1 avg. cars |
| 2026-08-21 | 225.4 avg. cars |
| 2026-08-28 | 175.1 avg. cars |
| 2026-09-04 | 253.1 avg. cars |
| 2026-09-11 | 260.3 avg. cars |
| 2026-09-18 | 224.1 avg. cars |
| 2026-09-25 | 194.7 avg. cars |
| 2026-10-02 | 206.4 avg. cars |
| 2026-10-09 | 287.3 avg. cars |
| 2026-10-16 | 206.1 avg. cars |
Latest observation comparisons
2026-10-16: 206.1 avg. cars
52-week comparison
+17.4 avg. cars (+9.2%)
Compared with 2025-10-17: 188.7 avg. cars.
Comparison dates & method
Comparisons use the latest observation above and stay the same when you change the chart period. They use the provider values currently held in the local history, including available revisions.
The 52-week comparison uses an observation within 3 days of the date 364 days earlier. Actual comparison dates are shown above.
Weekly average of daily loaded-car counts; the same car can recur. STCC 28 excludes separately reported ethanol and fertilizer.
History & comparisons — Union Pacific · Chemical cars held 48+ hours
2025-10-10 – 2026-10-16 · 54 observations
avg. cars
Point to the chart, or focus it and use the left and right arrow keys, to inspect recorded values.
Available history only. Lines connect recorded observations; values between them are not supplied.
Recorded values
| Observation date | Value (avg. cars) |
|---|---|
| 2025-10-10 | 274.0 avg. cars |
| 2025-10-17 | 263.0 avg. cars |
| 2025-10-24 | 262.0 avg. cars |
| 2025-10-31 | 306.0 avg. cars |
| 2025-11-07 | 298.0 avg. cars |
| 2025-11-14 | 238.0 avg. cars |
| 2025-11-21 | 211.0 avg. cars |
| 2025-11-28 | 238.0 avg. cars |
| 2025-12-05 | 267.0 avg. cars |
| 2025-12-12 | 251.0 avg. cars |
| 2025-12-19 | 236.0 avg. cars |
| 2025-12-26 | 310.0 avg. cars |
| 2026-01-02 | 228.0 avg. cars |
| 2026-01-09 | 179.0 avg. cars |
| 2026-01-16 | 170.0 avg. cars |
| 2026-01-23 | 219.0 avg. cars |
| 2026-01-30 | 246.0 avg. cars |
| 2026-02-06 | 212.0 avg. cars |
| 2026-02-13 | 197.0 avg. cars |
| 2026-02-20 | 163.0 avg. cars |
| 2026-02-27 | 227.0 avg. cars |
| 2026-03-06 | 222.0 avg. cars |
| 2026-03-13 | 200.0 avg. cars |
| 2026-03-20 | 245.0 avg. cars |
| 2026-03-27 | 258.0 avg. cars |
| 2026-04-03 | 227.0 avg. cars |
| 2026-04-10 | 230.0 avg. cars |
| 2026-04-17 | 205.0 avg. cars |
| 2026-04-24 | 212.0 avg. cars |
| 2026-05-01 | 224.0 avg. cars |
| 2026-05-08 | 236.0 avg. cars |
| 2026-05-15 | 172.0 avg. cars |
| 2026-05-22 | 183.0 avg. cars |
| 2026-05-29 | 223.0 avg. cars |
| 2026-06-05 | 207.0 avg. cars |
| 2026-06-12 | 182.0 avg. cars |
| 2026-06-19 | 239.0 avg. cars |
| 2026-06-26 | 266.0 avg. cars |
| 2026-07-03 | 220.0 avg. cars |
| 2026-07-10 | 233.0 avg. cars |
| 2026-07-17 | 212.0 avg. cars |
| 2026-07-24 | 232.0 avg. cars |
| 2026-07-31 | 235.0 avg. cars |
| 2026-08-07 | 222.0 avg. cars |
| 2026-08-14 | 191.0 avg. cars |
| 2026-08-21 | 206.0 avg. cars |
| 2026-08-28 | 241.0 avg. cars |
| 2026-09-04 | 240.0 avg. cars |
| 2026-09-11 | 278.0 avg. cars |
| 2026-09-18 | 231.0 avg. cars |
| 2026-09-25 | 209.0 avg. cars |
| 2026-10-02 | 206.0 avg. cars |
| 2026-10-09 | 195.0 avg. cars |
| 2026-10-16 | 204.0 avg. cars |
Latest observation comparisons
2026-10-16: 204.0 avg. cars
52-week comparison
−59.0 avg. cars (−22.4%)
Compared with 2025-10-17: 263.0 avg. cars.
Comparison dates & method
Comparisons use the latest observation above and stay the same when you change the chart period. They use the provider values currently held in the local history, including available revisions.
The 52-week comparison uses an observation within 3 days of the date 364 days earlier. Actual comparison dates are shown above.
Production indexes track manufacturing activity; the amount shipped by truck depends on product, location and transportation choices.
What to watch: Plant openings and outages, manufacturing demand, import competition, storage and fertilizer seasons.
Related reporting
Why More Chemical Fleets Are Re-Evaluating Truck Layouts
Sponsored content from Paragon: Why available space, service access, and equipment integration matter when evaluating chemical truck layouts.
ENEOS Agrees to Acquire TPC Group’s Gulf Coast Chemical Platform
A pending merger would move TPC’s Houston C4 production and two Gulf Coast terminals into ENEOS’s materials business, but no highway-capacity increase has been…

Brazil Ethanol Tariff Hits 67 Million Gallons—but Fuel Hauling Is Only a Fraction
Brazil shipped roughly 67 million gallons of ethanol to the United States in 2025, but most of that volume was industrial alcohol rather than…
Dairy & Food Ingredients
Browse coverageMilk, cream, edible oils, sweeteners, juices and dry food ingredients serve processors and food manufacturers through dedicated supply networks.
History & comparisons — Dairy Product Output
2025-08-01 – 2026-09-01 · 14 observations
index (2017=100)
Point to the chart, or focus it and use the left and right arrow keys, to inspect recorded values.
Available history only. Lines connect recorded observations; values between them are not supplied.
Recorded values
| Observation date | Value (index (2017=100)) |
|---|---|
| 2025-08-01 | 108.6 index (2017=100) |
| 2025-09-01 | 109.7 index (2017=100) |
| 2025-10-01 | 108.0 index (2017=100) |
| 2025-11-01 | 108.4 index (2017=100) |
| 2025-12-01 | 107.7 index (2017=100) |
| 2026-01-01 | 108.5 index (2017=100) |
| 2026-02-01 | 108.6 index (2017=100) |
| 2026-03-01 | 107.5 index (2017=100) |
| 2026-04-01 | 109.7 index (2017=100) |
| 2026-05-01 | 110.0 index (2017=100) |
| 2026-06-01 | 109.6 index (2017=100) |
| 2026-07-01 | 110.4 index (2017=100) |
| 2026-08-01 | 109.8 index (2017=100) |
| 2026-09-01 | 109.2 index (2017=100) |
Latest observation comparisons
2026-09-01: 109.2 index (2017=100)
Year-over-year
−0.5 index points (−0.5%)
Compared with 2025-09-01: 109.7 index (2017=100).
Comparison dates & method
Comparisons use the latest observation above and stay the same when you change the chart period. They use the provider values currently held in the local history, including available revisions.
The yearly comparison uses the same reporting month in the previous calendar year.
History & comparisons — Beverage Manufacturing Output
2025-08-01 – 2026-09-01 · 14 observations
index (2017=100)
Point to the chart, or focus it and use the left and right arrow keys, to inspect recorded values.
Available history only. Lines connect recorded observations; values between them are not supplied.
Recorded values
| Observation date | Value (index (2017=100)) |
|---|---|
| 2025-08-01 | 99.2 index (2017=100) |
| 2025-09-01 | 99.0 index (2017=100) |
| 2025-10-01 | 97.6 index (2017=100) |
| 2025-11-01 | 98.5 index (2017=100) |
| 2025-12-01 | 94.6 index (2017=100) |
| 2026-01-01 | 92.6 index (2017=100) |
| 2026-02-01 | 98.1 index (2017=100) |
| 2026-03-01 | 98.0 index (2017=100) |
| 2026-04-01 | 95.5 index (2017=100) |
| 2026-05-01 | 97.6 index (2017=100) |
| 2026-06-01 | 94.5 index (2017=100) |
| 2026-07-01 | 95.2 index (2017=100) |
| 2026-08-01 | 93.0 index (2017=100) |
| 2026-09-01 | 93.7 index (2017=100) |
Latest observation comparisons
2026-09-01: 93.7 index (2017=100)
Year-over-year
−5.3 index points (−5.3%)
Compared with 2025-09-01: 99.0 index (2017=100).
Comparison dates & method
Comparisons use the latest observation above and stay the same when you change the chart period. They use the provider values currently held in the local history, including available revisions.
The yearly comparison uses the same reporting month in the previous calendar year.
History & comparisons — Sugar & Confectionery Product Output
2025-08-01 – 2026-09-01 · 14 observations
index (2017=100)
Point to the chart, or focus it and use the left and right arrow keys, to inspect recorded values.
Available history only. Lines connect recorded observations; values between them are not supplied.
Recorded values
| Observation date | Value (index (2017=100)) |
|---|---|
| 2025-08-01 | 100.5 index (2017=100) |
| 2025-09-01 | 93.7 index (2017=100) |
| 2025-10-01 | 88.5 index (2017=100) |
| 2025-11-01 | 95.8 index (2017=100) |
| 2025-12-01 | 95.0 index (2017=100) |
| 2026-01-01 | 91.4 index (2017=100) |
| 2026-02-01 | 92.8 index (2017=100) |
| 2026-03-01 | 86.7 index (2017=100) |
| 2026-04-01 | 84.6 index (2017=100) |
| 2026-05-01 | 88.9 index (2017=100) |
| 2026-06-01 | 83.3 index (2017=100) |
| 2026-07-01 | 81.5 index (2017=100) |
| 2026-08-01 | 87.8 index (2017=100) |
| 2026-09-01 | 87.2 index (2017=100) |
Latest observation comparisons
2026-09-01: 87.2 index (2017=100)
Year-over-year
−6.5 index points (−6.9%)
Compared with 2025-09-01: 93.7 index (2017=100).
Comparison dates & method
Comparisons use the latest observation above and stay the same when you change the chart period. They use the provider values currently held in the local history, including available revisions.
The yearly comparison uses the same reporting month in the previous calendar year.
U.S. milk supply
Monthly raw-milk production across all U.S. states, in million pounds. Compare the same month a year earlier for seasonal context; production is not a count of milk-tanker shipments.
Estimated total U.S. milk production in million pounds, excluding milk sucked by calves. Monthly totals are not seasonally adjusted and reflect different month lengths; this is milk supply, not tanker loads or haulage rates.
History & comparisons — U.S. Milk Production
2025-07-01 – 2026-08-01 · 14 observations
million lb
Point to the chart, or focus it and use the left and right arrow keys, to inspect recorded values.
Available history only. Lines connect recorded observations; values between them are not supplied.
Recorded values
| Observation date | Value (million lb) |
|---|---|
| 2025-07-01 | 19,706 million lb |
| 2025-08-01 | 19,560 million lb |
| 2025-09-01 | 18,942 million lb |
| 2025-10-01 | 19,469 million lb |
| 2025-11-01 | 18,804 million lb |
| 2025-12-01 | 19,529 million lb |
| 2026-01-01 | 19,875 million lb |
| 2026-02-01 | 18,263 million lb |
| 2026-03-01 | 20,465 million lb |
| 2026-04-01 | 19,960 million lb |
| 2026-05-01 | 20,529 million lb |
| 2026-06-01 | 19,829 million lb |
| 2026-07-01 | 20,045 million lb |
| 2026-08-01 | 19,900 million lb |
Latest observation comparisons
2026-08-01: 19,900 million lb
Year-over-year
+340 million lb (+1.7%)
Compared with 2025-08-01: 19,560 million lb.
Comparison dates & method
Comparisons use the latest observation above and stay the same when you change the chart period. They use the provider values currently held in the local history, including available revisions.
The yearly comparison uses the same reporting month in the previous calendar year.
Dairy, beverage and sugar-related manufacturing indexes cover processing activity, including finished products; they are not raw-milk or food-tanker shipment counts.
What to watch: Processing capacity, plant consolidations, seasonal supply, food safety and changes in collection or delivery distance.
Related reporting

SEMO Tank at 50: From Dairy Equipment to Broader Tank-Fleet Support
Founded in 1976, SEMO Tank has developed from a dairy-equipment specialist into a four-location supplier supporting tank fleets with equipment, parts, repairs and rebuilding.

Trimac Acquires California Freight in Major Food-Grade Expansion
Trimac’s purchase of California Freight adds an established raw-milk tanker, food-grade warehousing and brokerage network across California and Nevada.

Ninth Avenue Foods Plant: $76M East Texas Dairy Build Targets 2027
A Texas filing details the $76 million, 288,786-square-foot Ninth Avenue Foods dairy plant in Longview and the future food-grade freight opportunity around it.
Agriculture & Feed
Browse coverageGrain, oilseeds, feed ingredients and agricultural processing link farms, mills, livestock operations and export terminals.
History & comparisons — Grain & Oilseed Milling Output
2025-08-01 – 2026-09-01 · 14 observations
index (2017=100)
Point to the chart, or focus it and use the left and right arrow keys, to inspect recorded values.
Available history only. Lines connect recorded observations; values between them are not supplied.
Recorded values
| Observation date | Value (index (2017=100)) |
|---|---|
| 2025-08-01 | 125.1 index (2017=100) |
| 2025-09-01 | 122.6 index (2017=100) |
| 2025-10-01 | 124.3 index (2017=100) |
| 2025-11-01 | 125.7 index (2017=100) |
| 2025-12-01 | 125.5 index (2017=100) |
| 2026-01-01 | 126.4 index (2017=100) |
| 2026-02-01 | 125.5 index (2017=100) |
| 2026-03-01 | 125.4 index (2017=100) |
| 2026-04-01 | 125.3 index (2017=100) |
| 2026-05-01 | 121.6 index (2017=100) |
| 2026-06-01 | 126.0 index (2017=100) |
| 2026-07-01 | 125.6 index (2017=100) |
| 2026-08-01 | 123.9 index (2017=100) |
| 2026-09-01 | 125.1 index (2017=100) |
Latest observation comparisons
2026-09-01: 125.1 index (2017=100)
Year-over-year
+2.5 index points (+2.0%)
Compared with 2025-09-01: 122.6 index (2017=100).
Comparison dates & method
Comparisons use the latest observation above and stay the same when you change the chart period. They use the provider values currently held in the local history, including available revisions.
The yearly comparison uses the same reporting month in the previous calendar year.
History & comparisons — Animal Food Manufacturing Output
2025-08-01 – 2026-09-01 · 14 observations
index (2017=100)
Point to the chart, or focus it and use the left and right arrow keys, to inspect recorded values.
Available history only. Lines connect recorded observations; values between them are not supplied.
Recorded values
| Observation date | Value (index (2017=100)) |
|---|---|
| 2025-08-01 | 93.0 index (2017=100) |
| 2025-09-01 | 93.9 index (2017=100) |
| 2025-10-01 | 96.4 index (2017=100) |
| 2025-11-01 | 94.2 index (2017=100) |
| 2025-12-01 | 93.6 index (2017=100) |
| 2026-01-01 | 95.2 index (2017=100) |
| 2026-02-01 | 95.6 index (2017=100) |
| 2026-03-01 | 95.5 index (2017=100) |
| 2026-04-01 | 96.5 index (2017=100) |
| 2026-05-01 | 96.2 index (2017=100) |
| 2026-06-01 | 98.5 index (2017=100) |
| 2026-07-01 | 95.9 index (2017=100) |
| 2026-08-01 | 95.6 index (2017=100) |
| 2026-09-01 | 94.3 index (2017=100) |
Latest observation comparisons
2026-09-01: 94.3 index (2017=100)
Year-over-year
+0.4 index points (+0.5%)
Compared with 2025-09-01: 93.9 index (2017=100).
Comparison dates & method
Comparisons use the latest observation above and stay the same when you change the chart period. They use the provider values currently held in the local history, including available revisions.
The yearly comparison uses the same reporting month in the previous calendar year.
Grain transportation
Weekly Mississippi River grain movement, a St. Louis barge-rate benchmark and grain carloads originated by BNSF and Union Pacific. These are separate transport measures, not a national total or dry-bulk trucking rates.
Weekly downbound corn, soybeans, wheat and other grain through Mississippi River Locks 27 near St. Louis, in short tons. One lock only; not total Mississippi-system traffic or truck tonnage.
History & comparisons — Grain Barges: Mississippi Locks 27 Seasonal chart available
2025-10-11 – 2026-10-17 · 54 observations
short tons
Point to the chart, or focus it and use the left and right arrow keys, to inspect recorded values.
Available history only. Lines connect recorded observations; values between them are not supplied.
Recorded values
| Observation date | Value (short tons) |
|---|---|
| 2025-10-11 | 328,200 short tons |
| 2025-10-18 | 447,700 short tons |
| 2025-10-25 | 542,900 short tons |
| 2025-11-01 | 661,400 short tons |
| 2025-11-08 | 600,000 short tons |
| 2025-11-15 | 565,400 short tons |
| 2025-11-22 | 686,700 short tons |
| 2025-11-29 | 406,100 short tons |
| 2025-12-06 | 440,700 short tons |
| 2025-12-13 | 661,700 short tons |
| 2025-12-20 | 327,322 short tons |
| 2025-12-27 | 278,900 short tons |
| 2026-01-03 | 552,500 short tons |
| 2026-01-10 | 384,300 short tons |
| 2026-01-17 | 313,017 short tons |
| 2026-01-24 | 292,600 short tons |
| 2026-01-31 | 71,300 short tons |
| 2026-02-07 | 71,500 short tons |
| 2026-02-14 | 175,900 short tons |
| 2026-02-21 | 250,100 short tons |
| 2026-02-28 | 322,600 short tons |
| 2026-03-07 | 315,000 short tons |
| 2026-03-14 | 319,300 short tons |
| 2026-03-21 | 395,900 short tons |
| 2026-03-28 | 432,000 short tons |
| 2026-04-04 | 378,400 short tons |
| 2026-04-11 | 391,000 short tons |
| 2026-04-18 | 513,100 short tons |
| 2026-04-25 | 578,900 short tons |
| 2026-05-02 | 599,050 short tons |
| 2026-05-09 | 499,600 short tons |
| 2026-05-16 | 550,900 short tons |
| 2026-05-23 | 543,720 short tons |
| 2026-05-30 | 511,800 short tons |
| 2026-06-06 | 556,500 short tons |
| 2026-06-13 | 460,000 short tons |
| 2026-06-20 | 401,500 short tons |
| 2026-06-27 | 529,700 short tons |
| 2026-07-04 | 482,200 short tons |
| 2026-07-11 | 580,300 short tons |
| 2026-07-18 | 563,900 short tons |
| 2026-07-25 | 703,800 short tons |
| 2026-08-01 | 609,400 short tons |
| 2026-08-08 | 631,700 short tons |
| 2026-08-15 | 548,900 short tons |
| 2026-08-22 | 388,800 short tons |
| 2026-08-29 | 448,100 short tons |
| 2026-09-05 | 267,500 short tons |
| 2026-09-12 | 260,600 short tons |
| 2026-09-19 | 178,400 short tons |
| 2026-09-26 | 153,944 short tons |
| 2026-10-03 | 84,300 short tons |
| 2026-10-10 | 103,900 short tons |
| 2026-10-17 | 349,600 short tons |
Latest observation comparisons
2026-10-17: 349,600 short tons
52-week comparison
−98,100 short tons (−21.9%)
Compared with 2025-10-18: 447,700 short tons.
Seasonal context
−72,000 short tons (−17.1%)
Compared with the same-season median of 5 available prior years: 421,600 short tons.
Historical range: 265,806 short tons to 498,100 short tons.
Compare seasons — 2026 / 2025
Calendar-year comparison. 2026 data through 2026-10-17; later positions contain historical context only.
- 2026
- 2025
- Range of 3–5 prior years
short tons
Point to the chart, or focus it and use the arrow keys, to compare a seasonal week. Home and End reach the first and last positions.
Weekly positions follow the latest observation’s weekday. Each year uses its nearest recorded observation within 3 days of that calendar date, within the same year. February 29 maps to February 28 in other years. Missing weeks break the lines and range; values are not filled in.
The shaded range uses the lowest and highest matched observations from the previous 5 calendar years, with at least 3 years at each position. Coverage can vary by week. This is historical context, not a forecast.
Seasonal dates & values
| Seasonal position | 2026 | 2025 | Historical range |
|---|---|---|---|
| 2026-01-03 | 2026-01-03: 552,500 short tons | 2025-01-04: 429,949 short tons | Low 216,800 short tons (2024-01-06); high 429,949 short tons (2025-01-04). 4 years: 2025, 2024, 2022, 2021. |
| 2026-01-10 | 2026-01-10: 384,300 short tons | 2025-01-11: 258,800 short tons | Low 103,900 short tons (2023-01-07); high 358,100 short tons (2024-01-13). 5 years: 2025, 2024, 2023, 2022, 2021. |
| 2026-01-17 | 2026-01-17: 313,017 short tons | 2025-01-18: 258,800 short tons | Low 117,400 short tons (2024-01-20); high 491,100 short tons (2021-01-16). 5 years: 2025, 2024, 2023, 2022, 2021. |
| 2026-01-24 | 2026-01-24: 292,600 short tons | 2025-01-25: 272,900 short tons | Low 152,436 short tons (2024-01-27); high 525,140 short tons (2021-01-23). 5 years: 2025, 2024, 2023, 2022, 2021. |
| 2026-01-31 | 2026-01-31: 71,300 short tons | 2025-02-01: 279,600 short tons | Low 156,000 short tons (2022-01-29); high 452,900 short tons (2021-01-30). 5 years: 2025, 2024, 2023, 2022, 2021. |
| 2026-02-07 | 2026-02-07: 71,500 short tons | 2025-02-08: 382,366 short tons | Low 184,001 short tons (2024-02-10); high 382,366 short tons (2025-02-08). 5 years: 2025, 2024, 2023, 2022, 2021. |
| 2026-02-14 | 2026-02-14: 175,900 short tons | 2025-02-15: 336,000 short tons | Low 176,100 short tons (2022-02-12); high 336,000 short tons (2025-02-15). 5 years: 2025, 2024, 2023, 2022, 2021. |
| 2026-02-21 | 2026-02-21: 250,100 short tons | 2025-02-22: 216,400 short tons | Low 150,800 short tons (2022-02-19); high 264,800 short tons (2024-02-24). 5 years: 2025, 2024, 2023, 2022, 2021. |
| 2026-02-28 | 2026-02-28: 322,600 short tons | 2025-03-01: 161,100 short tons | Low 161,100 short tons (2025-03-01); high 224,000 short tons (2021-02-27). 5 years: 2025, 2024, 2023, 2022, 2021. |
| 2026-03-07 | 2026-03-07: 315,000 short tons | 2025-03-08: 150,900 short tons | Low 135,100 short tons (2023-03-04); high 437,100 short tons (2021-03-06). 5 years: 2025, 2024, 2023, 2022, 2021. |
| 2026-03-14 | 2026-03-14: 319,300 short tons | 2025-03-15: 367,700 short tons | Low 183,700 short tons (2023-03-11); high 447,700 short tons (2021-03-13). 5 years: 2025, 2024, 2023, 2022, 2021. |
| 2026-03-21 | 2026-03-21: 395,900 short tons | 2025-03-22: 358,200 short tons | Low 322,880 short tons (2022-03-19); high 413,300 short tons (2024-03-23). 5 years: 2025, 2024, 2023, 2022, 2021. |
| 2026-03-28 | 2026-03-28: 432,000 short tons | 2025-03-29: 369,400 short tons | Low 362,100 short tons (2023-03-25); high 547,500 short tons (2021-03-27). 5 years: 2025, 2024, 2023, 2022, 2021. |
| 2026-04-04 | 2026-04-04: 378,400 short tons | 2025-04-05: 203,900 short tons | Low 203,900 short tons (2025-04-05); high 449,900 short tons (2021-04-03). 5 years: 2025, 2024, 2023, 2022, 2021. |
| 2026-04-11 | 2026-04-11: 391,000 short tons | 2025-04-12: 446,800 short tons | Low 274,600 short tons (2024-04-13); high 630,500 short tons (2021-04-10). 5 years: 2025, 2024, 2023, 2022, 2021. |
| 2026-04-18 | 2026-04-18: 513,100 short tons | 2025-04-19: 390,500 short tons | Low 280,074 short tons (2024-04-20); high 640,448 short tons (2021-04-17). 5 years: 2025, 2024, 2023, 2022, 2021. |
| 2026-04-25 | 2026-04-25: 578,900 short tons | 2025-04-26: 527,102 short tons | Low 291,000 short tons (2024-04-27); high 758,400 short tons (2021-04-24). 5 years: 2025, 2024, 2023, 2022, 2021. |
| 2026-05-02 | 2026-05-02: 599,050 short tons | 2025-05-03: 630,200 short tons | Low 266,500 short tons (2024-05-04); high 630,200 short tons (2025-05-03). 5 years: 2025, 2024, 2023, 2022, 2021. |
| 2026-05-09 | 2026-05-09: 499,600 short tons | 2025-05-10: 572,800 short tons | Low 237,232 short tons (2023-05-06); high 848,200 short tons (2021-05-08). 5 years: 2025, 2024, 2023, 2022, 2021. |
| 2026-05-16 | 2026-05-16: 550,900 short tons | 2025-05-17: 663,800 short tons | Low 173,861 short tons (2023-05-13); high 684,300 short tons (2021-05-15). 5 years: 2025, 2024, 2023, 2022, 2021. |
| 2026-05-23 | 2026-05-23: 543,720 short tons | 2025-05-24: 602,750 short tons | Low 317,444 short tons (2023-05-20); high 857,520 short tons (2021-05-22). 5 years: 2025, 2024, 2023, 2022, 2021. |
| 2026-05-30 | 2026-05-30: 511,800 short tons | 2025-05-31: 730,920 short tons | Low 408,900 short tons (2024-06-01); high 751,700 short tons (2022-05-28). 5 years: 2025, 2024, 2023, 2022, 2021. |
| 2026-06-06 | 2026-06-06: 556,500 short tons | 2025-06-07: 588,300 short tons | Low 261,200 short tons (2024-06-08); high 923,400 short tons (2021-06-05). 5 years: 2025, 2024, 2023, 2022, 2021. |
| 2026-06-13 | 2026-06-13: 460,000 short tons | 2025-06-14: 625,000 short tons | Low 360,200 short tons (2023-06-10); high 744,200 short tons (2021-06-12). 5 years: 2025, 2024, 2023, 2022, 2021. |
| 2026-06-20 | 2026-06-20: 401,500 short tons | 2025-06-21: 669,300 short tons | Low 269,300 short tons (2024-06-22); high 669,300 short tons (2025-06-21). 5 years: 2025, 2024, 2023, 2022, 2021. |
| 2026-06-27 | 2026-06-27: 529,700 short tons | 2025-06-28: 508,700 short tons | Low 303,140 short tons (2023-06-24); high 661,780 short tons (2021-06-26). 5 years: 2025, 2024, 2023, 2022, 2021. |
| 2026-07-04 | 2026-07-04: 482,200 short tons | 2025-07-05: 684,600 short tons | Low 293,000 short tons (2024-07-06); high 719,900 short tons (2022-07-02). 5 years: 2025, 2024, 2023, 2022, 2021. |
| 2026-07-11 | 2026-07-11: 580,300 short tons | 2025-07-12: 452,000 short tons | Low 72,300 short tons (2024-07-13); high 536,480 short tons (2021-07-10). 5 years: 2025, 2024, 2023, 2022, 2021. |
| 2026-07-18 | 2026-07-18: 563,900 short tons | 2025-07-19: 642,420 short tons | Low 131,000 short tons (2024-07-20); high 642,420 short tons (2025-07-19). 5 years: 2025, 2024, 2023, 2022, 2021. |
| 2026-07-25 | 2026-07-25: 703,800 short tons | 2025-07-26: 736,800 short tons | Low 285,500 short tons (2023-07-22); high 736,800 short tons (2025-07-26). 5 years: 2025, 2024, 2023, 2022, 2021. |
| 2026-08-01 | 2026-08-01: 609,400 short tons | 2025-08-02: 664,400 short tons | Low 318,800 short tons (2023-07-29); high 664,400 short tons (2025-08-02). 5 years: 2025, 2024, 2023, 2022, 2021. |
| 2026-08-08 | 2026-08-08: 631,700 short tons | 2025-08-09: 678,700 short tons | Low 232,200 short tons (2023-08-05); high 678,700 short tons (2025-08-09). 5 years: 2025, 2024, 2023, 2022, 2021. |
| 2026-08-15 | 2026-08-15: 548,900 short tons | 2025-08-16: 548,800 short tons | Low 215,900 short tons (2023-08-12); high 548,800 short tons (2025-08-16). 5 years: 2025, 2024, 2023, 2022, 2021. |
| 2026-08-22 | 2026-08-22: 388,800 short tons | 2025-08-23: 412,800 short tons | Low 140,600 short tons (2023-08-19); high 412,800 short tons (2025-08-23). 5 years: 2025, 2024, 2023, 2022, 2021. |
| 2026-08-29 | 2026-08-29: 448,100 short tons | 2025-08-30: 292,900 short tons | Low 133,300 short tons (2023-08-26); high 300,400 short tons (2024-08-31). 5 years: 2025, 2024, 2023, 2022, 2021. |
| 2026-09-05 | 2026-09-05: 267,500 short tons | 2025-09-06: 252,700 short tons | Low 23,700 short tons (2023-09-02); high 282,700 short tons (2024-09-07). 5 years: 2025, 2024, 2023, 2022, 2021. |
| 2026-09-12 | 2026-09-12: 260,600 short tons | 2025-09-13: 123,100 short tons | Low 82,200 short tons (2023-09-09); high 149,100 short tons (2022-09-10). 5 years: 2025, 2024, 2023, 2022, 2021. |
| 2026-09-19 | 2026-09-19: 178,400 short tons | 2025-09-20: 136,400 short tons | Low 45,100 short tons (2021-09-18); high 230,300 short tons (2024-09-21). 5 years: 2025, 2024, 2023, 2022, 2021. |
| 2026-09-26 | 2026-09-26: 153,944 short tons | 2025-09-27: 182,300 short tons | Low 36,600 short tons (2021-09-25); high 182,300 short tons (2025-09-27). 5 years: 2025, 2024, 2023, 2022, 2021. |
| 2026-10-03 | 2026-10-03: 84,300 short tons | 2025-10-04: 208,600 short tons | Low 110,637 short tons (2023-09-30); high 208,600 short tons (2025-10-04). 5 years: 2025, 2024, 2023, 2022, 2021. |
| 2026-10-10 | 2026-10-10: 103,900 short tons | 2025-10-11: 328,200 short tons | Low 123,600 short tons (2023-10-07); high 343,000 short tons (2024-10-12). 5 years: 2025, 2024, 2023, 2022, 2021. |
| 2026-10-17 | 2026-10-17: 349,600 short tons | 2025-10-18: 447,700 short tons | Low 265,806 short tons (2023-10-14); high 498,100 short tons (2021-10-16). 5 years: 2025, 2024, 2023, 2022, 2021. |
| 2026-10-24 | Unavailable | 2025-10-25: 542,900 short tons | Low 306,900 short tons (2021-10-23); high 542,900 short tons (2025-10-25). 5 years: 2025, 2024, 2023, 2022, 2021. |
| 2026-10-31 | Unavailable | 2025-11-01: 661,400 short tons | Low 341,800 short tons (2022-10-29); high 661,400 short tons (2025-11-01). 5 years: 2025, 2024, 2023, 2022, 2021. |
| 2026-11-07 | Unavailable | 2025-11-08: 600,000 short tons | Low 359,700 short tons (2021-11-06); high 600,000 short tons (2025-11-08). 5 years: 2025, 2024, 2023, 2022, 2021. |
| 2026-11-14 | Unavailable | 2025-11-15: 565,400 short tons | Low 389,811 short tons (2023-11-11); high 577,900 short tons (2021-11-13). 5 years: 2025, 2024, 2023, 2022, 2021. |
| 2026-11-21 | Unavailable | 2025-11-22: 686,700 short tons | Low 423,864 short tons (2023-11-18); high 686,700 short tons (2025-11-22). 5 years: 2025, 2024, 2023, 2022, 2021. |
| 2026-11-28 | Unavailable | 2025-11-29: 406,100 short tons | Low 389,700 short tons (2021-11-27); high 556,100 short tons (2023-11-25). 5 years: 2025, 2024, 2023, 2022, 2021. |
| 2026-12-05 | Unavailable | 2025-12-06: 440,700 short tons | Low 422,800 short tons (2023-12-02); high 651,600 short tons (2021-12-04). 5 years: 2025, 2024, 2023, 2022, 2021. |
| 2026-12-12 | Unavailable | 2025-12-13: 661,700 short tons | Low 387,711 short tons (2023-12-09); high 661,700 short tons (2025-12-13). 5 years: 2025, 2024, 2023, 2022, 2021. |
| 2026-12-19 | Unavailable | 2025-12-20: 327,322 short tons | Low 327,322 short tons (2025-12-20); high 553,600 short tons (2022-12-17). 5 years: 2025, 2024, 2023, 2022, 2021. |
| 2026-12-26 | Unavailable | 2025-12-27: 278,900 short tons | Low 278,900 short tons (2025-12-27); high 667,700 short tons (2024-12-28). 5 years: 2025, 2024, 2023, 2022, 2021. |
Comparison dates & method
Comparisons use the latest observation above and stay the same when you change the chart period. They use the provider values currently held in the local history, including available revisions.
The 52-week comparison uses an observation within 3 days of the date 364 days earlier. Actual comparison dates are shown above.
Seasonal context uses one observation within 3 days of the same calendar date in each of the previous 5 years, where available. At least 3 years are required. The displayed range describes those observations; it is not a forecast or a full-year high/low.
| Observation date | Value |
|---|---|
| 2025-10-18 | 447,700 short tons |
| 2024-10-19 | 266,399 short tons |
| 2023-10-14 | 265,806 short tons |
| 2022-10-15 | 421,600 short tons |
| 2021-10-16 | 498,100 short tons |
Weekly downbound spot grain barge rate originating at St. Louis, as a percentage of its 1976 tariff benchmark. This is a barge-rate quote, not dollars per ton or a truck freight rate.
History & comparisons — St. Louis Grain Barge Rate Seasonal chart available
2025-10-14 – 2026-10-20 · 54 observations
% of 1976 tariff
Point to the chart, or focus it and use the left and right arrow keys, to inspect recorded values.
Available history only. Lines connect recorded observations; values between them are not supplied.
Recorded values
| Observation date | Value (% of 1976 tariff) |
|---|---|
| 2025-10-14 | 501.4 % of 1976 tariff |
| 2025-10-21 | 493.1 % of 1976 tariff |
| 2025-10-28 | 493.1 % of 1976 tariff |
| 2025-11-04 | 498.6 % of 1976 tariff |
| 2025-11-11 | 491.4 % of 1976 tariff |
| 2025-11-18 | 471.4 % of 1976 tariff |
| 2025-11-25 | 456.6 % of 1976 tariff |
| 2025-12-02 | 440.9 % of 1976 tariff |
| 2025-12-09 | 453.6 % of 1976 tariff |
| 2025-12-16 | 503.4 % of 1976 tariff |
| 2025-12-23 | 497.5 % of 1976 tariff |
| 2025-12-30 | 499.7 % of 1976 tariff |
| 2026-01-06 | 509.7 % of 1976 tariff |
| 2026-01-13 | 516.4 % of 1976 tariff |
| 2026-01-20 | 539.6 % of 1976 tariff |
| 2026-01-27 | 610.4 % of 1976 tariff |
| 2026-02-03 | 618.1 % of 1976 tariff |
| 2026-02-10 | 606.9 % of 1976 tariff |
| 2026-02-17 | 624.1 % of 1976 tariff |
| 2026-02-24 | 619.7 % of 1976 tariff |
| 2026-03-03 | 578.4 % of 1976 tariff |
| 2026-03-10 | 507.2 % of 1976 tariff |
| 2026-03-17 | 481.9 % of 1976 tariff |
| 2026-03-24 | 448.4 % of 1976 tariff |
| 2026-03-31 | 453.4 % of 1976 tariff |
| 2026-04-07 | 456.9 % of 1976 tariff |
| 2026-04-14 | 457.8 % of 1976 tariff |
| 2026-04-21 | 454.1 % of 1976 tariff |
| 2026-04-28 | 454.7 % of 1976 tariff |
| 2026-05-05 | 457.2 % of 1976 tariff |
| 2026-05-12 | 452.8 % of 1976 tariff |
| 2026-05-19 | 453.4 % of 1976 tariff |
| 2026-05-26 | 450.3 % of 1976 tariff |
| 2026-06-02 | 408.6 % of 1976 tariff |
| 2026-06-09 | 404.2 % of 1976 tariff |
| 2026-06-16 | 381.4 % of 1976 tariff |
| 2026-06-23 | 369.7 % of 1976 tariff |
| 2026-06-30 | 375.3 % of 1976 tariff |
| 2026-07-07 | 389.1 % of 1976 tariff |
| 2026-07-14 | 476.6 % of 1976 tariff |
| 2026-07-21 | 532.8 % of 1976 tariff |
| 2026-07-28 | 642.2 % of 1976 tariff |
| 2026-08-04 | 637.8 % of 1976 tariff |
| 2026-08-11 | 630.4 % of 1976 tariff |
| 2026-08-18 | 587.5 % of 1976 tariff |
| 2026-08-25 | 579.7 % of 1976 tariff |
| 2026-09-01 | 682.8 % of 1976 tariff |
| 2026-09-08 | 792.2 % of 1976 tariff |
| 2026-09-15 | 818.1 % of 1976 tariff |
| 2026-09-22 | 834.7 % of 1976 tariff |
| 2026-09-29 | 758.9 % of 1976 tariff |
| 2026-10-06 | 723.2 % of 1976 tariff |
| 2026-10-13 | 673.4 % of 1976 tariff |
| 2026-10-20 | 592.2 % of 1976 tariff |
Latest observation comparisons
2026-10-20: 592.2 % of 1976 tariff
52-week comparison
+99.1 percentage points
Compared with 2025-10-21: 493.1 % of 1976 tariff.
Seasonal context
−161.4 percentage points
Compared with the same-season median of 5 available prior years: 753.6 % of 1976 tariff.
Historical range: 493.1 % of 1976 tariff to 1,818.8 % of 1976 tariff.
Compare seasons — 2026 / 2025
Calendar-year comparison. 2026 data through 2026-10-20; later positions contain historical context only.
- 2026
- 2025
- Range of 3–5 prior years
% of 1976 tariff
Point to the chart, or focus it and use the arrow keys, to compare a seasonal week. Home and End reach the first and last positions.
Weekly positions follow the latest observation’s weekday. Each year uses its nearest recorded observation within 3 days of that calendar date, within the same year. February 29 maps to February 28 in other years. Missing weeks break the lines and range; values are not filled in.
The shaded range uses the lowest and highest matched observations from the previous 5 calendar years, with at least 3 years at each position. Coverage can vary by week. This is historical context, not a forecast.
Seasonal dates & values
| Seasonal position | 2026 | 2025 | Historical range |
|---|---|---|---|
| 2026-01-06 | 2026-01-06: 509.7 % of 1976 tariff | 2025-01-07: 381.6 % of 1976 tariff | Low 303.8 % of 1976 tariff (2021-01-05); high 725.0 % of 1976 tariff (2023-01-03). 5 years: 2025, 2024, 2023, 2022, 2021. |
| 2026-01-13 | 2026-01-13: 516.4 % of 1976 tariff | 2025-01-14: 375.5 % of 1976 tariff | Low 302.5 % of 1976 tariff (2021-01-12); high 675.0 % of 1976 tariff (2022-01-11). 5 years: 2025, 2024, 2023, 2022, 2021. |
| 2026-01-20 | 2026-01-20: 539.6 % of 1976 tariff | 2025-01-21: 370.0 % of 1976 tariff | Low 323.2 % of 1976 tariff (2024-01-23); high 730.0 % of 1976 tariff (2022-01-18). 5 years: 2025, 2024, 2023, 2022, 2021. |
| 2026-01-27 | 2026-01-27: 610.4 % of 1976 tariff | 2025-01-28: 370.0 % of 1976 tariff | Low 282.5 % of 1976 tariff (2021-01-26); high 775.0 % of 1976 tariff (2022-01-25). 5 years: 2025, 2024, 2023, 2022, 2021. |
| 2026-02-03 | 2026-02-03: 618.1 % of 1976 tariff | 2025-02-04: 398.3 % of 1976 tariff | Low 295.0 % of 1976 tariff (2021-02-02); high 720.8 % of 1976 tariff (2022-02-01). 5 years: 2025, 2024, 2023, 2022, 2021. |
| 2026-02-10 | 2026-02-10: 606.9 % of 1976 tariff | 2025-02-11: 472.9 % of 1976 tariff | Low 279.0 % of 1976 tariff (2021-02-09); high 628.0 % of 1976 tariff (2022-02-08). 5 years: 2025, 2024, 2023, 2022, 2021. |
| 2026-02-17 | 2026-02-17: 624.1 % of 1976 tariff | 2025-02-18: 468.8 % of 1976 tariff | Low 273.8 % of 1976 tariff (2021-02-16); high 567.0 % of 1976 tariff (2022-02-15). 5 years: 2025, 2024, 2023, 2022, 2021. |
| 2026-02-24 | 2026-02-24: 619.7 % of 1976 tariff | 2025-02-25: 462.2 % of 1976 tariff | Low 271.3 % of 1976 tariff (2021-02-23); high 470.0 % of 1976 tariff (2022-02-22). 5 years: 2025, 2024, 2023, 2022, 2021. |
| 2026-03-03 | 2026-03-03: 578.4 % of 1976 tariff | 2025-03-04: 459.8 % of 1976 tariff | Low 265.0 % of 1976 tariff (2021-03-02); high 480.0 % of 1976 tariff (2022-03-01). 5 years: 2025, 2024, 2023, 2022, 2021. |
| 2026-03-10 | 2026-03-10: 507.2 % of 1976 tariff | 2025-03-11: 434.1 % of 1976 tariff | Low 263.8 % of 1976 tariff (2024-03-12); high 767.9 % of 1976 tariff (2022-03-08). 5 years: 2025, 2024, 2023, 2022, 2021. |
| 2026-03-17 | 2026-03-17: 481.9 % of 1976 tariff | 2025-03-18: 443.4 % of 1976 tariff | Low 271.3 % of 1976 tariff (2024-03-19); high 870.8 % of 1976 tariff (2022-03-15). 5 years: 2025, 2024, 2023, 2022, 2021. |
| 2026-03-24 | 2026-03-24: 448.4 % of 1976 tariff | 2025-03-25: 451.6 % of 1976 tariff | Low 259.3 % of 1976 tariff (2024-03-26); high 737.5 % of 1976 tariff (2022-03-22). 5 years: 2025, 2024, 2023, 2022, 2021. |
| 2026-03-31 | 2026-03-31: 453.4 % of 1976 tariff | 2025-04-01: 428.4 % of 1976 tariff | Low 240.9 % of 1976 tariff (2024-04-02); high 700.0 % of 1976 tariff (2022-03-29). 5 years: 2025, 2024, 2023, 2022, 2021. |
| 2026-04-07 | 2026-04-07: 456.9 % of 1976 tariff | 2025-04-08: 404.4 % of 1976 tariff | Low 227.7 % of 1976 tariff (2024-04-09); high 722.5 % of 1976 tariff (2022-04-05). 5 years: 2025, 2024, 2023, 2022, 2021. |
| 2026-04-14 | 2026-04-14: 457.8 % of 1976 tariff | 2025-04-15: 397.2 % of 1976 tariff | Low 216.7 % of 1976 tariff (2024-04-16); high 655.0 % of 1976 tariff (2022-04-12). 5 years: 2025, 2024, 2023, 2022, 2021. |
| 2026-04-21 | 2026-04-21: 454.1 % of 1976 tariff | 2025-04-22: 348.9 % of 1976 tariff | Low 207.4 % of 1976 tariff (2024-04-23); high 502.5 % of 1976 tariff (2022-04-19). 5 years: 2025, 2024, 2023, 2022, 2021. |
| 2026-04-28 | 2026-04-28: 454.7 % of 1976 tariff | 2025-04-29: 350.9 % of 1976 tariff | Low 211.4 % of 1976 tariff (2024-04-30); high 470.8 % of 1976 tariff (2022-04-26). 5 years: 2025, 2024, 2023, 2022, 2021. |
| 2026-05-05 | 2026-05-05: 457.2 % of 1976 tariff | 2025-05-06: 367.2 % of 1976 tariff | Low 228.8 % of 1976 tariff (2024-05-07); high 402.1 % of 1976 tariff (2022-05-03). 5 years: 2025, 2024, 2023, 2022, 2021. |
| 2026-05-12 | 2026-05-12: 452.8 % of 1976 tariff | 2025-05-13: 336.9 % of 1976 tariff | Low 222.5 % of 1976 tariff (2023-05-09); high 383.0 % of 1976 tariff (2022-05-10). 5 years: 2025, 2024, 2023, 2022, 2021. |
| 2026-05-19 | 2026-05-19: 453.4 % of 1976 tariff | 2025-05-20: 314.2 % of 1976 tariff | Low 226.3 % of 1976 tariff (2023-05-16); high 341.9 % of 1976 tariff (2022-05-17). 5 years: 2025, 2024, 2023, 2022, 2021. |
| 2026-05-26 | 2026-05-26: 450.3 % of 1976 tariff | 2025-05-27: 315.9 % of 1976 tariff | Low 211.4 % of 1976 tariff (2023-05-23); high 315.9 % of 1976 tariff (2025-05-27). 5 years: 2025, 2024, 2023, 2022, 2021. |
| 2026-06-02 | 2026-06-02: 408.6 % of 1976 tariff | 2025-06-03: 313.4 % of 1976 tariff | Low 203.1 % of 1976 tariff (2023-05-30); high 313.4 % of 1976 tariff (2025-06-03). 5 years: 2025, 2024, 2023, 2022, 2021. |
| 2026-06-09 | 2026-06-09: 404.2 % of 1976 tariff | 2025-06-10: 304.2 % of 1976 tariff | Low 202.1 % of 1976 tariff (2023-06-06); high 310.8 % of 1976 tariff (2022-06-07). 5 years: 2025, 2024, 2023, 2022, 2021. |
| 2026-06-16 | 2026-06-16: 381.4 % of 1976 tariff | 2025-06-17: 313.9 % of 1976 tariff | Low 206.6 % of 1976 tariff (2023-06-13); high 361.7 % of 1976 tariff (2022-06-14). 5 years: 2025, 2024, 2023, 2022, 2021. |
| 2026-06-23 | 2026-06-23: 369.7 % of 1976 tariff | 2025-06-24: 334.4 % of 1976 tariff | Low 203.0 % of 1976 tariff (2021-06-22); high 401.4 % of 1976 tariff (2022-06-21). 5 years: 2025, 2024, 2023, 2022, 2021. |
| 2026-06-30 | 2026-06-30: 375.3 % of 1976 tariff | 2025-07-01: 314.7 % of 1976 tariff | Low 200.0 % of 1976 tariff (2021-06-29); high 353.7 % of 1976 tariff (2022-06-28). 5 years: 2025, 2024, 2023, 2022, 2021. |
| 2026-07-07 | 2026-07-07: 389.1 % of 1976 tariff | 2025-07-08: 331.8 % of 1976 tariff | Low 199.2 % of 1976 tariff (2021-07-06); high 331.8 % of 1976 tariff (2025-07-08). 5 years: 2025, 2024, 2023, 2022, 2021. |
| 2026-07-14 | 2026-07-14: 476.6 % of 1976 tariff | 2025-07-15: 400.0 % of 1976 tariff | Low 200.0 % of 1976 tariff (2021-07-13); high 400.0 % of 1976 tariff (2025-07-15). 5 years: 2025, 2024, 2023, 2022, 2021. |
| 2026-07-21 | 2026-07-21: 532.8 % of 1976 tariff | 2025-07-22: 457.2 % of 1976 tariff | Low 202.5 % of 1976 tariff (2021-07-20); high 457.2 % of 1976 tariff (2025-07-22). 5 years: 2025, 2024, 2023, 2022, 2021. |
| 2026-07-28 | 2026-07-28: 642.2 % of 1976 tariff | 2025-07-29: 473.2 % of 1976 tariff | Low 202.0 % of 1976 tariff (2021-07-27); high 473.2 % of 1976 tariff (2025-07-29). 5 years: 2025, 2024, 2023, 2022, 2021. |
| 2026-08-04 | 2026-08-04: 637.8 % of 1976 tariff | 2025-08-05: 458.9 % of 1976 tariff | Low 256.0 % of 1976 tariff (2021-08-03); high 458.9 % of 1976 tariff (2025-08-05). 5 years: 2025, 2024, 2023, 2022, 2021. |
| 2026-08-11 | 2026-08-11: 630.4 % of 1976 tariff | 2025-08-12: 448.9 % of 1976 tariff | Low 260.0 % of 1976 tariff (2021-08-10); high 448.9 % of 1976 tariff (2025-08-12). 5 years: 2025, 2024, 2023, 2022, 2021. |
| 2026-08-18 | 2026-08-18: 587.5 % of 1976 tariff | 2025-08-19: 464.2 % of 1976 tariff | Low 282.0 % of 1976 tariff (2021-08-17); high 528.6 % of 1976 tariff (2024-08-20). 5 years: 2025, 2024, 2023, 2022, 2021. |
| 2026-08-25 | 2026-08-25: 579.7 % of 1976 tariff | 2025-08-26: 467.2 % of 1976 tariff | Low 306.7 % of 1976 tariff (2021-08-24); high 617.2 % of 1976 tariff (2024-08-27). 5 years: 2025, 2024, 2023, 2022, 2021. |
| 2026-09-01 | 2026-09-01: 682.8 % of 1976 tariff | 2025-09-02: 505.6 % of 1976 tariff | Low 381.0 % of 1976 tariff (2021-08-31); high 689.1 % of 1976 tariff (2024-09-03). 5 years: 2025, 2024, 2023, 2022, 2021. |
| 2026-09-08 | 2026-09-08: 792.2 % of 1976 tariff | 2025-09-09: 581.6 % of 1976 tariff | Low 561.0 % of 1976 tariff (2022-09-06); high 793.8 % of 1976 tariff (2024-09-10). 5 years: 2025, 2024, 2023, 2022, 2021. |
| 2026-09-15 | 2026-09-15: 818.1 % of 1976 tariff | 2025-09-16: 615.3 % of 1976 tariff | Low 575.0 % of 1976 tariff (2021-09-14); high 810.7 % of 1976 tariff (2024-09-17). 5 years: 2025, 2024, 2023, 2022, 2021. |
| 2026-09-22 | 2026-09-22: 834.7 % of 1976 tariff | 2025-09-23: 618.6 % of 1976 tariff | Low 618.6 % of 1976 tariff (2025-09-23); high 961.1 % of 1976 tariff (2023-09-19). 5 years: 2025, 2024, 2023, 2022, 2021. |
| 2026-09-29 | 2026-09-29: 758.9 % of 1976 tariff | 2025-09-30: 601.8 % of 1976 tariff | Low 601.8 % of 1976 tariff (2025-09-30); high 1,326.4 % of 1976 tariff (2023-09-26). 5 years: 2025, 2024, 2023, 2022, 2021. |
| 2026-10-06 | 2026-10-06: 723.2 % of 1976 tariff | 2025-10-07: 473.6 % of 1976 tariff | Low 473.6 % of 1976 tariff (2025-10-07); high 2,266.7 % of 1976 tariff (2022-10-04). 5 years: 2025, 2024, 2023, 2022, 2021. |
| 2026-10-13 | 2026-10-13: 673.4 % of 1976 tariff | 2025-10-14: 501.4 % of 1976 tariff | Low 501.4 % of 1976 tariff (2025-10-14); high 2,653.1 % of 1976 tariff (2022-10-11). 5 years: 2025, 2024, 2023, 2022, 2021. |
| 2026-10-20 | 2026-10-20: 592.2 % of 1976 tariff | 2025-10-21: 493.1 % of 1976 tariff | Low 493.1 % of 1976 tariff (2025-10-21); high 1,818.8 % of 1976 tariff (2022-10-18). 5 years: 2025, 2024, 2023, 2022, 2021. |
| 2026-10-27 | Unavailable | 2025-10-28: 493.1 % of 1976 tariff | Low 493.1 % of 1976 tariff (2025-10-28); high 2,216.7 % of 1976 tariff (2022-10-25). 5 years: 2025, 2024, 2023, 2022, 2021. |
| 2026-11-03 | Unavailable | 2025-11-04: 498.6 % of 1976 tariff | Low 404.2 % of 1976 tariff (2021-11-02); high 2,007.9 % of 1976 tariff (2022-11-01). 5 years: 2025, 2024, 2023, 2022, 2021. |
| 2026-11-10 | Unavailable | 2025-11-11: 491.4 % of 1976 tariff | Low 416.0 % of 1976 tariff (2021-11-09); high 1,020.8 % of 1976 tariff (2022-11-08). 5 years: 2025, 2024, 2023, 2022, 2021. |
| 2026-11-17 | Unavailable | 2025-11-18: 471.4 % of 1976 tariff | Low 362.0 % of 1976 tariff (2021-11-16); high 1,025.0 % of 1976 tariff (2022-11-15). 5 years: 2025, 2024, 2023, 2022, 2021. |
| 2026-11-24 | Unavailable | 2025-11-25: 456.6 % of 1976 tariff | Low 373.0 % of 1976 tariff (2021-11-23); high 850.0 % of 1976 tariff (2022-11-22). 5 years: 2025, 2024, 2023, 2022, 2021. |
| 2026-12-01 | Unavailable | 2025-12-02: 440.9 % of 1976 tariff | Low 374.0 % of 1976 tariff (2021-11-30); high 842.3 % of 1976 tariff (2022-11-29). 5 years: 2025, 2024, 2023, 2022, 2021. |
| 2026-12-08 | Unavailable | 2025-12-09: 453.6 % of 1976 tariff | Low 344.2 % of 1976 tariff (2023-12-05); high 805.6 % of 1976 tariff (2022-12-06). 5 years: 2025, 2024, 2023, 2022, 2021. |
| 2026-12-15 | Unavailable | 2025-12-16: 503.4 % of 1976 tariff | Low 326.9 % of 1976 tariff (2023-12-12); high 851.6 % of 1976 tariff (2022-12-13). 5 years: 2025, 2024, 2023, 2022, 2021. |
| 2026-12-22 | Unavailable | 2025-12-23: 497.5 % of 1976 tariff | Low 322.2 % of 1976 tariff (2023-12-19); high 842.9 % of 1976 tariff (2022-12-20). 5 years: 2025, 2024, 2023, 2022, 2021. |
| 2026-12-29 | Unavailable | 2025-12-30: 499.7 % of 1976 tariff | Low 319.0 % of 1976 tariff (2023-12-26); high 825.0 % of 1976 tariff (2022-12-27). 5 years: 2025, 2024, 2023, 2022, 2021. |
Comparison dates & method
Comparisons use the latest observation above and stay the same when you change the chart period. They use the provider values currently held in the local history, including available revisions.
The 52-week comparison uses an observation within 3 days of the date 364 days earlier. Actual comparison dates are shown above.
Seasonal context uses one observation within 3 days of the same calendar date in each of the previous 5 years, where available. At least 3 years are required. The displayed range describes those observations; it is not a forecast or a full-year high/low.
| Observation date | Value |
|---|---|
| 2025-10-21 | 493.1 % of 1976 tariff |
| 2024-10-22 | 753.6 % of 1976 tariff |
| 2023-10-17 | 577.9 % of 1976 tariff |
| 2022-10-18 | 1,818.8 % of 1976 tariff |
| 2021-10-19 | 789.2 % of 1976 tariff |
Weekly grain carloads originated by this railroad. Received interchange carloads are excluded. Selected carrier coverage, not national tonnage or truck demand.
History & comparisons — BNSF · Grain carloads originated
2025-10-11 – 2026-10-17 · 54 observations
carloads
Point to the chart, or focus it and use the left and right arrow keys, to inspect recorded values.
Available history only. Lines connect recorded observations; values between them are not supplied.
Recorded values
| Observation date | Value (carloads) |
|---|---|
| 2025-10-11 | 13,327 carloads |
| 2025-10-18 | 11,069 carloads |
| 2025-10-25 | 11,738 carloads |
| 2025-11-01 | 13,886 carloads |
| 2025-11-08 | 12,777 carloads |
| 2025-11-15 | 14,105 carloads |
| 2025-11-22 | 14,314 carloads |
| 2025-11-29 | 12,468 carloads |
| 2025-12-06 | 13,179 carloads |
| 2025-12-13 | 12,846 carloads |
| 2025-12-20 | 12,233 carloads |
| 2025-12-27 | 11,678 carloads |
| 2026-01-03 | 11,681 carloads |
| 2026-01-10 | 13,663 carloads |
| 2026-01-17 | 13,440 carloads |
| 2026-01-24 | 11,181 carloads |
| 2026-01-31 | 13,305 carloads |
| 2026-02-07 | 12,088 carloads |
| 2026-02-14 | 14,770 carloads |
| 2026-02-21 | 13,359 carloads |
| 2026-02-28 | 14,014 carloads |
| 2026-03-07 | 13,276 carloads |
| 2026-03-14 | 13,906 carloads |
| 2026-03-21 | 12,740 carloads |
| 2026-03-28 | 12,816 carloads |
| 2026-04-04 | 13,906 carloads |
| 2026-04-11 | 12,672 carloads |
| 2026-04-18 | 14,034 carloads |
| 2026-04-25 | 12,938 carloads |
| 2026-05-02 | 14,128 carloads |
| 2026-05-09 | 12,489 carloads |
| 2026-05-16 | 12,546 carloads |
| 2026-05-23 | 13,063 carloads |
| 2026-05-30 | 14,995 carloads |
| 2026-06-06 | 11,513 carloads |
| 2026-06-13 | 13,285 carloads |
| 2026-06-20 | 12,645 carloads |
| 2026-06-27 | 11,911 carloads |
| 2026-07-04 | 11,546 carloads |
| 2026-07-11 | 11,182 carloads |
| 2026-07-18 | 11,997 carloads |
| 2026-07-25 | 12,342 carloads |
| 2026-08-01 | 12,160 carloads |
| 2026-08-08 | 11,142 carloads |
| 2026-08-15 | 12,505 carloads |
| 2026-08-22 | 12,748 carloads |
| 2026-08-29 | 11,504 carloads |
| 2026-09-05 | 13,048 carloads |
| 2026-09-12 | 12,933 carloads |
| 2026-09-19 | 11,478 carloads |
| 2026-09-26 | 13,167 carloads |
| 2026-10-03 | 12,118 carloads |
| 2026-10-10 | 12,846 carloads |
| 2026-10-17 | 11,584 carloads |
Latest observation comparisons
2026-10-17: 11,584 carloads
52-week comparison
+515 carloads (+4.7%)
Compared with 2025-10-18: 11,069 carloads.
Comparison dates & method
Comparisons use the latest observation above and stay the same when you change the chart period. They use the provider values currently held in the local history, including available revisions.
The 52-week comparison uses an observation within 3 days of the date 364 days earlier. Actual comparison dates are shown above.
Weekly grain carloads originated by this railroad. Received interchange carloads are excluded. Selected carrier coverage, not national tonnage or truck demand.
History & comparisons — Union Pacific · Grain carloads originated
2025-10-11 – 2026-10-17 · 54 observations
carloads
Point to the chart, or focus it and use the left and right arrow keys, to inspect recorded values.
Available history only. Lines connect recorded observations; values between them are not supplied.
Recorded values
| Observation date | Value (carloads) |
|---|---|
| 2025-10-11 | 6,087 carloads |
| 2025-10-18 | 5,893 carloads |
| 2025-10-25 | 6,233 carloads |
| 2025-11-01 | 6,923 carloads |
| 2025-11-08 | 6,943 carloads |
| 2025-11-15 | 6,825 carloads |
| 2025-11-22 | 6,909 carloads |
| 2025-11-29 | 5,366 carloads |
| 2025-12-06 | 7,239 carloads |
| 2025-12-13 | 5,908 carloads |
| 2025-12-20 | 6,682 carloads |
| 2025-12-27 | 5,995 carloads |
| 2026-01-03 | 5,742 carloads |
| 2026-01-10 | 7,646 carloads |
| 2026-01-17 | 7,123 carloads |
| 2026-01-24 | 7,738 carloads |
| 2026-01-31 | 6,117 carloads |
| 2026-02-07 | 6,577 carloads |
| 2026-02-14 | 8,570 carloads |
| 2026-02-21 | 7,103 carloads |
| 2026-02-28 | 6,524 carloads |
| 2026-03-07 | 8,219 carloads |
| 2026-03-14 | 6,687 carloads |
| 2026-03-21 | 5,893 carloads |
| 2026-03-28 | 7,175 carloads |
| 2026-04-04 | 7,305 carloads |
| 2026-04-11 | 6,776 carloads |
| 2026-04-18 | 6,667 carloads |
| 2026-04-25 | 7,522 carloads |
| 2026-05-02 | 7,186 carloads |
| 2026-05-09 | 7,362 carloads |
| 2026-05-16 | 6,507 carloads |
| 2026-05-23 | 6,524 carloads |
| 2026-05-30 | 7,308 carloads |
| 2026-06-06 | 6,612 carloads |
| 2026-06-13 | 6,315 carloads |
| 2026-06-20 | 6,712 carloads |
| 2026-06-27 | 6,465 carloads |
| 2026-07-04 | 6,227 carloads |
| 2026-07-11 | 6,140 carloads |
| 2026-07-18 | 5,908 carloads |
| 2026-07-25 | 5,700 carloads |
| 2026-08-01 | 5,396 carloads |
| 2026-08-08 | 6,115 carloads |
| 2026-08-15 | 5,733 carloads |
| 2026-08-22 | 5,712 carloads |
| 2026-08-29 | 6,468 carloads |
| 2026-09-05 | 5,906 carloads |
| 2026-09-12 | 6,707 carloads |
| 2026-09-19 | 6,536 carloads |
| 2026-09-26 | 6,445 carloads |
| 2026-10-03 | 6,154 carloads |
| 2026-10-10 | 6,292 carloads |
| 2026-10-17 | 6,440 carloads |
Latest observation comparisons
2026-10-17: 6,440 carloads
52-week comparison
+547 carloads (+9.3%)
Compared with 2025-10-18: 5,893 carloads.
Comparison dates & method
Comparisons use the latest observation above and stay the same when you change the chart period. They use the provider values currently held in the local history, including available revisions.
The 52-week comparison uses an observation within 3 days of the date 364 days earlier. Actual comparison dates are shown above.
Fertilizer rail activity
Weekly fertilizer carloads originated by BNSF and Union Pacific. Compare each railroad with its own history; selected-carrier volumes do not establish national fertilizer demand.
Weekly fertilizer carloads originated by this railroad; the category covers multiple fertilizer types and forms. Received interchange carloads are excluded. Selected carrier coverage; do not add to chemical totals.
History & comparisons — BNSF · Fertilizer carloads originated
2025-10-11 – 2026-10-17 · 54 observations
carloads
Point to the chart, or focus it and use the left and right arrow keys, to inspect recorded values.
Available history only. Lines connect recorded observations; values between them are not supplied.
Recorded values
| Observation date | Value (carloads) |
|---|---|
| 2025-10-11 | 1,036 carloads |
| 2025-10-18 | 830 carloads |
| 2025-10-25 | 802 carloads |
| 2025-11-01 | 856 carloads |
| 2025-11-08 | 974 carloads |
| 2025-11-15 | 799 carloads |
| 2025-11-22 | 923 carloads |
| 2025-11-29 | 710 carloads |
| 2025-12-06 | 703 carloads |
| 2025-12-13 | 1,194 carloads |
| 2025-12-20 | 817 carloads |
| 2025-12-27 | 483 carloads |
| 2026-01-03 | 1,015 carloads |
| 2026-01-10 | 1,215 carloads |
| 2026-01-17 | 1,532 carloads |
| 2026-01-24 | 987 carloads |
| 2026-01-31 | 1,091 carloads |
| 2026-02-07 | 1,587 carloads |
| 2026-02-14 | 1,356 carloads |
| 2026-02-21 | 1,538 carloads |
| 2026-02-28 | 1,493 carloads |
| 2026-03-07 | 1,583 carloads |
| 2026-03-14 | 1,481 carloads |
| 2026-03-21 | 1,547 carloads |
| 2026-03-28 | 1,701 carloads |
| 2026-04-04 | 1,618 carloads |
| 2026-04-11 | 1,774 carloads |
| 2026-04-18 | 2,096 carloads |
| 2026-04-25 | 1,794 carloads |
| 2026-05-02 | 1,517 carloads |
| 2026-05-09 | 1,865 carloads |
| 2026-05-16 | 1,154 carloads |
| 2026-05-23 | 810 carloads |
| 2026-05-30 | 820 carloads |
| 2026-06-06 | 841 carloads |
| 2026-06-13 | 639 carloads |
| 2026-06-20 | 785 carloads |
| 2026-06-27 | 631 carloads |
| 2026-07-04 | 699 carloads |
| 2026-07-11 | 716 carloads |
| 2026-07-18 | 992 carloads |
| 2026-07-25 | 642 carloads |
| 2026-08-01 | 823 carloads |
| 2026-08-08 | 991 carloads |
| 2026-08-15 | 842 carloads |
| 2026-08-22 | 986 carloads |
| 2026-08-29 | 687 carloads |
| 2026-09-05 | 1,036 carloads |
| 2026-09-12 | 773 carloads |
| 2026-09-19 | 863 carloads |
| 2026-09-26 | 909 carloads |
| 2026-10-03 | 972 carloads |
| 2026-10-10 | 844 carloads |
| 2026-10-17 | 1,023 carloads |
Latest observation comparisons
2026-10-17: 1,023 carloads
52-week comparison
+193 carloads (+23.3%)
Compared with 2025-10-18: 830 carloads.
Comparison dates & method
Comparisons use the latest observation above and stay the same when you change the chart period. They use the provider values currently held in the local history, including available revisions.
The 52-week comparison uses an observation within 3 days of the date 364 days earlier. Actual comparison dates are shown above.
Weekly fertilizer carloads originated by this railroad; the category covers multiple fertilizer types and forms. Received interchange carloads are excluded. Selected carrier coverage; do not add to chemical totals.
History & comparisons — Union Pacific · Fertilizer carloads originated
2025-10-11 – 2026-10-17 · 54 observations
carloads
Point to the chart, or focus it and use the left and right arrow keys, to inspect recorded values.
Available history only. Lines connect recorded observations; values between them are not supplied.
Recorded values
| Observation date | Value (carloads) |
|---|---|
| 2025-10-11 | 1,079 carloads |
| 2025-10-18 | 970 carloads |
| 2025-10-25 | 1,187 carloads |
| 2025-11-01 | 1,101 carloads |
| 2025-11-08 | 1,296 carloads |
| 2025-11-15 | 1,133 carloads |
| 2025-11-22 | 1,139 carloads |
| 2025-11-29 | 1,033 carloads |
| 2025-12-06 | 1,136 carloads |
| 2025-12-13 | 1,340 carloads |
| 2025-12-20 | 1,303 carloads |
| 2025-12-27 | 1,222 carloads |
| 2026-01-03 | 1,194 carloads |
| 2026-01-10 | 1,343 carloads |
| 2026-01-17 | 1,458 carloads |
| 2026-01-24 | 1,415 carloads |
| 2026-01-31 | 1,203 carloads |
| 2026-02-07 | 1,655 carloads |
| 2026-02-14 | 1,335 carloads |
| 2026-02-21 | 1,656 carloads |
| 2026-02-28 | 1,627 carloads |
| 2026-03-07 | 1,507 carloads |
| 2026-03-14 | 1,539 carloads |
| 2026-03-21 | 1,538 carloads |
| 2026-03-28 | 1,573 carloads |
| 2026-04-04 | 1,381 carloads |
| 2026-04-11 | 1,339 carloads |
| 2026-04-18 | 1,616 carloads |
| 2026-04-25 | 1,586 carloads |
| 2026-05-02 | 1,558 carloads |
| 2026-05-09 | 1,425 carloads |
| 2026-05-16 | 1,570 carloads |
| 2026-05-23 | 1,318 carloads |
| 2026-05-30 | 1,202 carloads |
| 2026-06-06 | 1,077 carloads |
| 2026-06-13 | 1,126 carloads |
| 2026-06-20 | 1,123 carloads |
| 2026-06-27 | 1,458 carloads |
| 2026-07-04 | 1,008 carloads |
| 2026-07-11 | 1,244 carloads |
| 2026-07-18 | 1,979 carloads |
| 2026-07-25 | 1,257 carloads |
| 2026-08-01 | 1,195 carloads |
| 2026-08-08 | 1,547 carloads |
| 2026-08-15 | 1,595 carloads |
| 2026-08-22 | 1,461 carloads |
| 2026-08-29 | 1,282 carloads |
| 2026-09-05 | 1,382 carloads |
| 2026-09-12 | 1,768 carloads |
| 2026-09-19 | 1,543 carloads |
| 2026-09-26 | 1,954 carloads |
| 2026-10-03 | 1,541 carloads |
| 2026-10-10 | 1,494 carloads |
| 2026-10-17 | 1,477 carloads |
Latest observation comparisons
2026-10-17: 1,477 carloads
52-week comparison
+507 carloads (+52.3%)
Compared with 2025-10-18: 970 carloads.
Comparison dates & method
Comparisons use the latest observation above and stay the same when you change the chart period. They use the provider values currently held in the local history, including available revisions.
The 52-week comparison uses an observation within 3 days of the date 364 days earlier. Actual comparison dates are shown above.
Processing indexes describe milling and animal-food manufacturing. USDA grain reports add crop-shipment and multimodal freight context.
What to watch: Harvest timing, milling and crushing capacity, export demand, river conditions and rail or barge service.
Related reporting

Q4 2025 Refinery Outages: 12 Critical Impacts & Logistics Pressures That Squeeze Gulf Coast & Midwest Fuel Logistics
Q4 2025 refinery outages drove Gulf Coast and Midwest supply shifts; EIA weekly utilization fell as pipelines flexed and tanker dynamics adjusted. Gulf Coast…

National Milk Testing Strategy for H5N1: 5-Stage Blueprint
Discover how USDA’s National Milk Testing Strategy enhances H5N1 detection, supports dairy farm biosecurity, and ensures the safety of America’s milk supply.
Construction & Industrial Minerals
Browse coverageCement, lime, sand, aggregates, fly ash and asphalt support construction, infrastructure and industrial customers.
History & comparisons — Cement & Concrete Product Output
2025-08-01 – 2026-09-01 · 14 observations
index (2017=100)
Point to the chart, or focus it and use the left and right arrow keys, to inspect recorded values.
Available history only. Lines connect recorded observations; values between them are not supplied.
Recorded values
| Observation date | Value (index (2017=100)) |
|---|---|
| 2025-08-01 | 96.2 index (2017=100) |
| 2025-09-01 | 97.7 index (2017=100) |
| 2025-10-01 | 96.6 index (2017=100) |
| 2025-11-01 | 95.7 index (2017=100) |
| 2025-12-01 | 96.1 index (2017=100) |
| 2026-01-01 | 102.4 index (2017=100) |
| 2026-02-01 | 103.1 index (2017=100) |
| 2026-03-01 | 101.6 index (2017=100) |
| 2026-04-01 | 101.9 index (2017=100) |
| 2026-05-01 | 103.4 index (2017=100) |
| 2026-06-01 | 104.3 index (2017=100) |
| 2026-07-01 | 104.7 index (2017=100) |
| 2026-08-01 | 101.0 index (2017=100) |
| 2026-09-01 | 103.7 index (2017=100) |
Latest observation comparisons
2026-09-01: 103.7 index (2017=100)
Year-over-year
+6.1 index points (+6.2%)
Compared with 2025-09-01: 97.7 index (2017=100).
Comparison dates & method
Comparisons use the latest observation above and stay the same when you change the chart period. They use the provider values currently held in the local history, including available revisions.
The yearly comparison uses the same reporting month in the previous calendar year.
History & comparisons — Lime & Gypsum Product Output
2025-08-01 – 2026-09-01 · 14 observations
index (2017=100)
Point to the chart, or focus it and use the left and right arrow keys, to inspect recorded values.
Available history only. Lines connect recorded observations; values between them are not supplied.
Recorded values
| Observation date | Value (index (2017=100)) |
|---|---|
| 2025-08-01 | 106.5 index (2017=100) |
| 2025-09-01 | 102.9 index (2017=100) |
| 2025-10-01 | 96.3 index (2017=100) |
| 2025-11-01 | 94.9 index (2017=100) |
| 2025-12-01 | 93.2 index (2017=100) |
| 2026-01-01 | 97.5 index (2017=100) |
| 2026-02-01 | 98.7 index (2017=100) |
| 2026-03-01 | 102.6 index (2017=100) |
| 2026-04-01 | 105.1 index (2017=100) |
| 2026-05-01 | 107.4 index (2017=100) |
| 2026-06-01 | 108.6 index (2017=100) |
| 2026-07-01 | 105.6 index (2017=100) |
| 2026-08-01 | 103.7 index (2017=100) |
| 2026-09-01 | 102.1 index (2017=100) |
Latest observation comparisons
2026-09-01: 102.1 index (2017=100)
Year-over-year
−0.7 index points (−0.7%)
Compared with 2025-09-01: 102.9 index (2017=100).
Comparison dates & method
Comparisons use the latest observation above and stay the same when you change the chart period. They use the provider values currently held in the local history, including available revisions.
The yearly comparison uses the same reporting month in the previous calendar year.
History & comparisons — U.S. Total Construction Spending
2025-07-01 – 2026-08-01 · 14 observations
USD · million (SAAR)
Point to the chart, or focus it and use the left and right arrow keys, to inspect recorded values.
Available history only. Lines connect recorded observations; values between them are not supplied.
Recorded values
| Observation date | Value (USD · million (SAAR)) |
|---|---|
| 2025-07-01 | $2,242,633 million (SAAR) |
| 2025-08-01 | $2,242,024 million (SAAR) |
| 2025-09-01 | $2,245,799 million (SAAR) |
| 2025-10-01 | $2,241,141 million (SAAR) |
| 2025-11-01 | $2,220,726 million (SAAR) |
| 2025-12-01 | $2,215,955 million (SAAR) |
| 2026-01-01 | $2,195,636 million (SAAR) |
| 2026-02-01 | $2,189,683 million (SAAR) |
| 2026-03-01 | $2,199,399 million (SAAR) |
| 2026-04-01 | $2,168,231 million (SAAR) |
| 2026-05-01 | $2,168,396 million (SAAR) |
| 2026-06-01 | $2,187,350 million (SAAR) |
| 2026-07-01 | $2,184,474 million (SAAR) |
| 2026-08-01 | $2,203,129 million (SAAR) |
Latest observation comparisons
2026-08-01: $2,203,129 million (SAAR)
Year-over-year
−$38,895 million (SAAR) (−1.7%)
Compared with 2025-08-01: $2,242,024 million (SAAR).
Comparison dates & method
Comparisons use the latest observation above and stay the same when you change the chart period. They use the provider values currently held in the local history, including available revisions.
The yearly comparison uses the same reporting month in the previous calendar year.
Rail freight · stone, sand & gravel
Weekly crushed stone, sand and gravel carloads originated by BNSF and Union Pacific. Includes industrial uses such as frac sand. Compare each railroad with its own history; these are selected-carrier counts, not total construction demand.
Weekly crushed stone, sand and gravel carloads originated by this railroad. The category serves construction and industrial uses, including frac sand. Received interchange carloads are excluded. Selected carrier coverage, not national tonnage, construction demand or truckloads.
History & comparisons — BNSF · Stone, sand & gravel carloads originated
2025-10-11 – 2026-10-17 · 54 observations
carloads
Point to the chart, or focus it and use the left and right arrow keys, to inspect recorded values.
Available history only. Lines connect recorded observations; values between them are not supplied.
Recorded values
| Observation date | Value (carloads) |
|---|---|
| 2025-10-11 | 3,920 carloads |
| 2025-10-18 | 3,900 carloads |
| 2025-10-25 | 3,633 carloads |
| 2025-11-01 | 3,758 carloads |
| 2025-11-08 | 4,238 carloads |
| 2025-11-15 | 3,829 carloads |
| 2025-11-22 | 3,293 carloads |
| 2025-11-29 | 3,137 carloads |
| 2025-12-06 | 3,354 carloads |
| 2025-12-13 | 3,149 carloads |
| 2025-12-20 | 3,211 carloads |
| 2025-12-27 | 2,324 carloads |
| 2026-01-03 | 2,830 carloads |
| 2026-01-10 | 3,580 carloads |
| 2026-01-17 | 3,623 carloads |
| 2026-01-24 | 3,158 carloads |
| 2026-01-31 | 1,169 carloads |
| 2026-02-07 | 2,848 carloads |
| 2026-02-14 | 3,244 carloads |
| 2026-02-21 | 3,120 carloads |
| 2026-02-28 | 3,379 carloads |
| 2026-03-07 | 3,405 carloads |
| 2026-03-14 | 3,368 carloads |
| 2026-03-21 | 3,719 carloads |
| 2026-03-28 | 3,918 carloads |
| 2026-04-04 | 4,255 carloads |
| 2026-04-11 | 4,062 carloads |
| 2026-04-18 | 3,893 carloads |
| 2026-04-25 | 4,133 carloads |
| 2026-05-02 | 3,969 carloads |
| 2026-05-09 | 3,651 carloads |
| 2026-05-16 | 3,400 carloads |
| 2026-05-23 | 3,896 carloads |
| 2026-05-30 | 4,340 carloads |
| 2026-06-06 | 4,087 carloads |
| 2026-06-13 | 3,815 carloads |
| 2026-06-20 | 4,183 carloads |
| 2026-06-27 | 3,677 carloads |
| 2026-07-04 | 3,277 carloads |
| 2026-07-11 | 4,155 carloads |
| 2026-07-18 | 4,339 carloads |
| 2026-07-25 | 4,170 carloads |
| 2026-08-01 | 4,045 carloads |
| 2026-08-08 | 4,556 carloads |
| 2026-08-15 | 3,714 carloads |
| 2026-08-22 | 4,182 carloads |
| 2026-08-29 | 4,003 carloads |
| 2026-09-05 | 4,072 carloads |
| 2026-09-12 | 3,565 carloads |
| 2026-09-19 | 3,351 carloads |
| 2026-09-26 | 3,752 carloads |
| 2026-10-03 | 4,074 carloads |
| 2026-10-10 | 3,835 carloads |
| 2026-10-17 | 3,588 carloads |
Latest observation comparisons
2026-10-17: 3,588 carloads
52-week comparison
−312 carloads (−8.0%)
Compared with 2025-10-18: 3,900 carloads.
Comparison dates & method
Comparisons use the latest observation above and stay the same when you change the chart period. They use the provider values currently held in the local history, including available revisions.
The 52-week comparison uses an observation within 3 days of the date 364 days earlier. Actual comparison dates are shown above.
Weekly crushed stone, sand and gravel carloads originated by this railroad. The category serves construction and industrial uses, including frac sand. Received interchange carloads are excluded. Selected carrier coverage, not national tonnage, construction demand or truckloads.
History & comparisons — Union Pacific · Stone, sand & gravel carloads originated
2025-10-11 – 2026-10-17 · 54 observations
carloads
Point to the chart, or focus it and use the left and right arrow keys, to inspect recorded values.
Available history only. Lines connect recorded observations; values between them are not supplied.
Recorded values
| Observation date | Value (carloads) |
|---|---|
| 2025-10-11 | 7,935 carloads |
| 2025-10-18 | 9,141 carloads |
| 2025-10-25 | 9,050 carloads |
| 2025-11-01 | 8,006 carloads |
| 2025-11-08 | 8,567 carloads |
| 2025-11-15 | 8,761 carloads |
| 2025-11-22 | 8,661 carloads |
| 2025-11-29 | 5,709 carloads |
| 2025-12-06 | 7,646 carloads |
| 2025-12-13 | 7,520 carloads |
| 2025-12-20 | 8,469 carloads |
| 2025-12-27 | 5,564 carloads |
| 2026-01-03 | 5,888 carloads |
| 2026-01-10 | 7,912 carloads |
| 2026-01-17 | 7,296 carloads |
| 2026-01-24 | 7,555 carloads |
| 2026-01-31 | 4,504 carloads |
| 2026-02-07 | 7,051 carloads |
| 2026-02-14 | 7,645 carloads |
| 2026-02-21 | 7,561 carloads |
| 2026-02-28 | 7,427 carloads |
| 2026-03-07 | 7,073 carloads |
| 2026-03-14 | 7,782 carloads |
| 2026-03-21 | 7,860 carloads |
| 2026-03-28 | 7,924 carloads |
| 2026-04-04 | 8,046 carloads |
| 2026-04-11 | 8,153 carloads |
| 2026-04-18 | 8,280 carloads |
| 2026-04-25 | 7,937 carloads |
| 2026-05-02 | 7,528 carloads |
| 2026-05-09 | 7,869 carloads |
| 2026-05-16 | 7,823 carloads |
| 2026-05-23 | 7,350 carloads |
| 2026-05-30 | 6,217 carloads |
| 2026-06-06 | 7,745 carloads |
| 2026-06-13 | 7,501 carloads |
| 2026-06-20 | 7,623 carloads |
| 2026-06-27 | 7,226 carloads |
| 2026-07-04 | 7,136 carloads |
| 2026-07-11 | 7,354 carloads |
| 2026-07-18 | 7,374 carloads |
| 2026-07-25 | 7,169 carloads |
| 2026-08-01 | 8,157 carloads |
| 2026-08-08 | 7,910 carloads |
| 2026-08-15 | 8,569 carloads |
| 2026-08-22 | 8,041 carloads |
| 2026-08-29 | 8,757 carloads |
| 2026-09-05 | 8,130 carloads |
| 2026-09-12 | 8,676 carloads |
| 2026-09-19 | 9,384 carloads |
| 2026-09-26 | 8,972 carloads |
| 2026-10-03 | 7,246 carloads |
| 2026-10-10 | 8,070 carloads |
| 2026-10-17 | 8,665 carloads |
Latest observation comparisons
2026-10-17: 8,665 carloads
52-week comparison
−476 carloads (−5.2%)
Compared with 2025-10-18: 9,141 carloads.
Comparison dates & method
Comparisons use the latest observation above and stay the same when you change the chart period. They use the provider values currently held in the local history, including available revisions.
The 52-week comparison uses an observation within 3 days of the date 364 days earlier. Actual comparison dates are shown above.
Construction spending is a dollar measure at a seasonally adjusted annual rate. Output indexes provide industry context, not tonnage for each mineral.
What to watch: Building activity, infrastructure projects, quarry and plant capacity, seasonality and local delivery distances.
Gases & Cryogenic Products
Browse coverageLNG, LPG, carbon dioxide, oxygen and nitrogen depend on specialized production, storage and distribution equipment.
History & comparisons — Henry Hub Natural Gas
2025-10-17 – 2026-10-20 · 249 observations
$/MMBtu
Point to the chart, or focus it and use the left and right arrow keys, to inspect recorded values.
Available history only. Lines connect recorded observations; values between them are not supplied.
Recorded values
| Observation date | Value ($/MMBtu) |
|---|---|
| 2025-10-17 | $2.65/MMBtu |
| 2025-10-20 | $2.99/MMBtu |
| 2025-10-21 | $3.28/MMBtu |
| 2025-10-22 | $3.45/MMBtu |
| 2025-10-23 | $3.34/MMBtu |
| 2025-10-24 | $3.21/MMBtu |
| 2025-10-27 | $3.30/MMBtu |
| 2025-10-28 | $3.44/MMBtu |
| 2025-10-29 | $3.36/MMBtu |
| 2025-10-30 | $3.46/MMBtu |
| 2025-10-31 | $3.57/MMBtu |
| 2025-11-03 | $3.37/MMBtu |
| 2025-11-04 | $3.35/MMBtu |
| 2025-11-05 | $3.51/MMBtu |
| 2025-11-06 | $3.71/MMBtu |
| 2025-11-07 | $3.76/MMBtu |
| 2025-11-10 | $3.80/MMBtu |
| 2025-11-12 | $3.60/MMBtu |
| 2025-11-13 | $3.60/MMBtu |
| 2025-11-14 | $3.49/MMBtu |
| 2025-11-17 | $3.71/MMBtu |
| 2025-11-18 | $3.70/MMBtu |
| 2025-11-19 | $3.94/MMBtu |
| 2025-11-20 | $3.97/MMBtu |
| 2025-11-21 | $4.13/MMBtu |
| 2025-11-24 | $4.15/MMBtu |
| 2025-11-25 | $4.12/MMBtu |
| 2025-11-26 | $4.59/MMBtu |
| 2025-12-01 | $5.08/MMBtu |
| 2025-12-02 | $4.83/MMBtu |
| 2025-12-03 | $4.86/MMBtu |
| 2025-12-04 | $4.89/MMBtu |
| 2025-12-05 | $5.19/MMBtu |
| 2025-12-08 | $5.19/MMBtu |
| 2025-12-09 | $4.76/MMBtu |
| 2025-12-10 | $4.62/MMBtu |
| 2025-12-11 | $4.35/MMBtu |
| 2025-12-12 | $4.07/MMBtu |
| 2025-12-15 | $3.90/MMBtu |
| 2025-12-16 | $3.58/MMBtu |
| 2025-12-17 | $3.66/MMBtu |
| 2025-12-18 | $3.87/MMBtu |
| 2025-12-19 | $3.58/MMBtu |
| 2025-12-22 | $3.67/MMBtu |
| 2025-12-23 | $3.38/MMBtu |
| 2025-12-24 | $3.31/MMBtu |
| 2025-12-29 | $4.35/MMBtu |
| 2025-12-30 | $4.40/MMBtu |
| 2025-12-31 | $4.00/MMBtu |
| 2026-01-05 | $2.82/MMBtu |
| 2026-01-06 | $2.85/MMBtu |
| 2026-01-07 | $3.10/MMBtu |
| 2026-01-08 | $2.92/MMBtu |
| 2026-01-09 | $2.87/MMBtu |
| 2026-01-12 | $2.90/MMBtu |
| 2026-01-13 | $3.00/MMBtu |
| 2026-01-14 | $3.13/MMBtu |
| 2026-01-15 | $2.92/MMBtu |
| 2026-01-16 | $3.06/MMBtu |
| 2026-01-20 | $4.00/MMBtu |
| 2026-01-21 | $4.96/MMBtu |
| 2026-01-22 | $8.42/MMBtu |
| 2026-01-23 | $30.72/MMBtu |
| 2026-01-26 | $25.01/MMBtu |
| 2026-01-27 | $17.19/MMBtu |
| 2026-01-28 | $9.34/MMBtu |
| 2026-01-29 | $10.25/MMBtu |
| 2026-01-30 | $7.18/MMBtu |
| 2026-02-02 | $4.40/MMBtu |
| 2026-02-03 | $4.11/MMBtu |
| 2026-02-04 | $6.88/MMBtu |
| 2026-02-05 | $5.28/MMBtu |
| 2026-02-06 | $4.37/MMBtu |
| 2026-02-09 | $3.25/MMBtu |
| 2026-02-10 | $3.18/MMBtu |
| 2026-02-11 | $3.25/MMBtu |
| 2026-02-12 | $3.43/MMBtu |
| 2026-02-13 | $3.24/MMBtu |
| 2026-02-17 | $3.13/MMBtu |
| 2026-02-18 | $2.98/MMBtu |
| 2026-02-19 | $3.09/MMBtu |
| 2026-02-20 | $3.15/MMBtu |
| 2026-02-23 | $3.13/MMBtu |
| 2026-02-24 | $2.99/MMBtu |
| 2026-02-25 | $3.02/MMBtu |
| 2026-02-26 | $2.94/MMBtu |
| 2026-02-27 | $2.99/MMBtu |
| 2026-03-02 | $2.99/MMBtu |
| 2026-03-03 | $3.10/MMBtu |
| 2026-03-04 | $2.87/MMBtu |
| 2026-03-05 | $2.90/MMBtu |
| 2026-03-06 | $3.10/MMBtu |
| 2026-03-09 | $3.25/MMBtu |
| 2026-03-10 | $3.08/MMBtu |
| 2026-03-11 | $3.15/MMBtu |
| 2026-03-12 | $3.27/MMBtu |
| 2026-03-13 | $3.20/MMBtu |
| 2026-03-16 | $3.03/MMBtu |
| 2026-03-17 | $3.14/MMBtu |
| 2026-03-18 | $3.12/MMBtu |
| 2026-03-19 | $3.21/MMBtu |
| 2026-03-20 | $3.04/MMBtu |
| 2026-03-23 | $2.94/MMBtu |
| 2026-03-24 | $2.90/MMBtu |
| 2026-03-25 | $2.94/MMBtu |
| 2026-03-26 | $2.99/MMBtu |
| 2026-03-27 | $2.99/MMBtu |
| 2026-03-30 | $2.88/MMBtu |
| 2026-03-31 | $2.88/MMBtu |
| 2026-04-01 | $2.99/MMBtu |
| 2026-04-02 | $2.86/MMBtu |
| 2026-04-06 | $3.04/MMBtu |
| 2026-04-07 | $3.01/MMBtu |
| 2026-04-08 | $2.78/MMBtu |
| 2026-04-09 | $2.78/MMBtu |
| 2026-04-10 | $2.64/MMBtu |
| 2026-04-13 | $2.79/MMBtu |
| 2026-04-14 | $2.79/MMBtu |
| 2026-04-15 | $2.78/MMBtu |
| 2026-04-16 | $2.78/MMBtu |
| 2026-04-17 | $2.71/MMBtu |
| 2026-04-20 | $2.81/MMBtu |
| 2026-04-21 | $2.76/MMBtu |
| 2026-04-22 | $2.75/MMBtu |
| 2026-04-23 | $2.65/MMBtu |
| 2026-04-24 | $2.54/MMBtu |
| 2026-04-27 | $2.72/MMBtu |
| 2026-04-28 | $2.70/MMBtu |
| 2026-04-29 | $2.60/MMBtu |
| 2026-04-30 | $2.64/MMBtu |
| 2026-05-01 | $2.63/MMBtu |
| 2026-05-04 | $2.67/MMBtu |
| 2026-05-05 | $2.83/MMBtu |
| 2026-05-06 | $2.75/MMBtu |
| 2026-05-07 | $2.70/MMBtu |
| 2026-05-08 | $2.75/MMBtu |
| 2026-05-11 | $2.82/MMBtu |
| 2026-05-12 | $2.91/MMBtu |
| 2026-05-13 | $2.88/MMBtu |
| 2026-05-14 | $2.79/MMBtu |
| 2026-05-15 | $2.89/MMBtu |
| 2026-05-18 | $3.07/MMBtu |
| 2026-05-19 | $3.23/MMBtu |
| 2026-05-20 | $3.18/MMBtu |
| 2026-05-21 | $3.14/MMBtu |
| 2026-05-22 | $2.92/MMBtu |
| 2026-05-26 | $3.10/MMBtu |
| 2026-05-27 | $3.13/MMBtu |
| 2026-05-28 | $3.04/MMBtu |
| 2026-05-29 | $3.34/MMBtu |
| 2026-06-01 | $3.07/MMBtu |
| 2026-06-02 | $2.97/MMBtu |
| 2026-06-03 | $2.97/MMBtu |
| 2026-06-04 | $3.08/MMBtu |
| 2026-06-05 | $3.05/MMBtu |
| 2026-06-08 | $3.10/MMBtu |
| 2026-06-09 | $3.18/MMBtu |
| 2026-06-10 | $3.27/MMBtu |
| 2026-06-11 | $3.16/MMBtu |
| 2026-06-12 | $3.06/MMBtu |
| 2026-06-15 | $3.06/MMBtu |
| 2026-06-16 | $3.10/MMBtu |
| 2026-06-17 | $3.25/MMBtu |
| 2026-06-18 | $3.08/MMBtu |
| 2026-06-22 | $3.16/MMBtu |
| 2026-06-23 | $3.15/MMBtu |
| 2026-06-24 | $3.19/MMBtu |
| 2026-06-25 | $3.21/MMBtu |
| 2026-06-26 | $3.26/MMBtu |
| 2026-06-29 | $3.33/MMBtu |
| 2026-06-30 | $3.34/MMBtu |
| 2026-07-01 | $3.34/MMBtu |
| 2026-07-02 | $3.34/MMBtu |
| 2026-07-06 | $3.29/MMBtu |
| 2026-07-07 | $3.13/MMBtu |
| 2026-07-08 | $3.13/MMBtu |
| 2026-07-09 | $3.17/MMBtu |
| 2026-07-10 | $2.73/MMBtu |
| 2026-07-13 | $2.83/MMBtu |
| 2026-07-14 | $2.76/MMBtu |
| 2026-07-15 | $2.80/MMBtu |
| 2026-07-16 | $2.83/MMBtu |
| 2026-07-17 | $2.75/MMBtu |
| 2026-07-20 | $2.80/MMBtu |
| 2026-07-21 | $2.80/MMBtu |
| 2026-07-22 | $2.93/MMBtu |
| 2026-07-23 | $2.92/MMBtu |
| 2026-07-24 | $2.87/MMBtu |
| 2026-07-27 | $2.63/MMBtu |
| 2026-07-28 | $2.65/MMBtu |
| 2026-07-29 | $2.58/MMBtu |
| 2026-07-30 | $2.65/MMBtu |
| 2026-07-31 | $2.59/MMBtu |
| 2026-08-03 | $2.81/MMBtu |
| 2026-08-04 | $2.74/MMBtu |
| 2026-08-05 | $2.60/MMBtu |
| 2026-08-06 | $2.60/MMBtu |
| 2026-08-07 | $2.56/MMBtu |
| 2026-08-10 | $2.72/MMBtu |
| 2026-08-11 | $2.79/MMBtu |
| 2026-08-12 | $2.82/MMBtu |
| 2026-08-13 | $2.82/MMBtu |
| 2026-08-14 | $2.79/MMBtu |
| 2026-08-17 | $2.77/MMBtu |
| 2026-08-18 | $2.82/MMBtu |
| 2026-08-19 | $2.94/MMBtu |
| 2026-08-20 | $2.94/MMBtu |
| 2026-08-21 | $2.82/MMBtu |
| 2026-08-24 | $2.83/MMBtu |
| 2026-08-25 | $2.70/MMBtu |
| 2026-08-26 | $2.81/MMBtu |
| 2026-08-27 | $2.89/MMBtu |
| 2026-08-28 | $2.82/MMBtu |
| 2026-08-31 | $2.90/MMBtu |
| 2026-09-01 | $2.90/MMBtu |
| 2026-09-02 | $2.88/MMBtu |
| 2026-09-03 | $2.95/MMBtu |
| 2026-09-04 | $2.92/MMBtu |
| 2026-09-08 | $2.90/MMBtu |
| 2026-09-09 | $2.81/MMBtu |
| 2026-09-10 | $2.76/MMBtu |
| 2026-09-11 | $2.71/MMBtu |
| 2026-09-14 | $2.85/MMBtu |
| 2026-09-15 | $2.97/MMBtu |
| 2026-09-16 | $3.00/MMBtu |
| 2026-09-17 | $2.90/MMBtu |
| 2026-09-18 | $2.97/MMBtu |
| 2026-09-21 | $2.93/MMBtu |
| 2026-09-22 | $2.90/MMBtu |
| 2026-09-23 | $3.06/MMBtu |
| 2026-09-24 | $3.00/MMBtu |
| 2026-09-25 | $3.21/MMBtu |
| 2026-09-28 | $3.13/MMBtu |
| 2026-09-29 | $3.18/MMBtu |
| 2026-09-30 | $3.02/MMBtu |
| 2026-10-01 | $3.00/MMBtu |
| 2026-10-02 | $2.90/MMBtu |
| 2026-10-05 | $2.96/MMBtu |
| 2026-10-06 | $3.03/MMBtu |
| 2026-10-07 | $3.16/MMBtu |
| 2026-10-08 | $3.24/MMBtu |
| 2026-10-09 | $3.10/MMBtu |
| 2026-10-12 | $3.10/MMBtu |
| 2026-10-13 | $3.14/MMBtu |
| 2026-10-14 | $3.22/MMBtu |
| 2026-10-15 | $3.30/MMBtu |
| 2026-10-16 | $3.22/MMBtu |
| 2026-10-19 | $3.28/MMBtu |
| 2026-10-20 | $3.10/MMBtu |
Latest observation comparisons
2026-10-20: $3.10/MMBtu
Year-over-year
+$0.11/MMBtu (+3.7%)
Compared with 2025-10-20: $2.99/MMBtu.
Comparison dates & method
Comparisons use the latest observation above and stay the same when you change the chart period. They use the provider values currently held in the local history, including available revisions.
The yearly comparison uses the calendar anniversary, or the closest earlier recorded day within 4 days. February 29 is compared with February 28 in a non-leap year.
History & comparisons — U.S. Propane Producer Price Index
2025-08-01 – 2026-09-01 · 14 observations
index (1982=100)
Point to the chart, or focus it and use the left and right arrow keys, to inspect recorded values.
Available history only. Lines connect recorded observations; values between them are not supplied.
Recorded values
| Observation date | Value (index (1982=100)) |
|---|---|
| 2025-08-01 | 142.5 index (1982=100) |
| 2025-09-01 | 147.2 index (1982=100) |
| 2025-10-01 | 138.9 index (1982=100) |
| 2025-11-01 | 129.2 index (1982=100) |
| 2025-12-01 | 141.1 index (1982=100) |
| 2026-01-01 | 134.8 index (1982=100) |
| 2026-02-01 | 132.7 index (1982=100) |
| 2026-03-01 | 166.7 index (1982=100) |
| 2026-04-01 | 167.2 index (1982=100) |
| 2026-05-01 | 180.3 index (1982=100) |
| 2026-06-01 | 162.2 index (1982=100) |
| 2026-07-01 | 151.0 index (1982=100) |
| 2026-08-01 | 141.5 index (1982=100) |
| 2026-09-01 | 176.7 index (1982=100) |
Latest observation comparisons
2026-09-01: 176.7 index (1982=100)
Year-over-year
+29.5 index points (+20.0%)
Compared with 2025-09-01: 147.2 index (1982=100).
Comparison dates & method
Comparisons use the latest observation above and stay the same when you change the chart period. They use the provider values currently held in the local history, including available revisions.
The yearly comparison uses the same reporting month in the previous calendar year.
History & comparisons — Industrial Gas Manufacturing Output
2025-08-01 – 2026-09-01 · 14 observations
index (2017=100)
Point to the chart, or focus it and use the left and right arrow keys, to inspect recorded values.
Available history only. Lines connect recorded observations; values between them are not supplied.
Recorded values
| Observation date | Value (index (2017=100)) |
|---|---|
| 2025-08-01 | 125.5 index (2017=100) |
| 2025-09-01 | 124.1 index (2017=100) |
| 2025-10-01 | 125.7 index (2017=100) |
| 2025-11-01 | 128.5 index (2017=100) |
| 2025-12-01 | 125.6 index (2017=100) |
| 2026-01-01 | 126.1 index (2017=100) |
| 2026-02-01 | 129.1 index (2017=100) |
| 2026-03-01 | 129.1 index (2017=100) |
| 2026-04-01 | 127.5 index (2017=100) |
| 2026-05-01 | 127.8 index (2017=100) |
| 2026-06-01 | 127.2 index (2017=100) |
| 2026-07-01 | 120.7 index (2017=100) |
| 2026-08-01 | 124.0 index (2017=100) |
| 2026-09-01 | 121.0 index (2017=100) |
Latest observation comparisons
2026-09-01: 121.0 index (2017=100)
Year-over-year
−3.1 index points (−2.5%)
Compared with 2025-09-01: 124.1 index (2017=100).
Comparison dates & method
Comparisons use the latest observation above and stay the same when you change the chart period. They use the provider values currently held in the local history, including available revisions.
The yearly comparison uses the same reporting month in the previous calendar year.
Henry Hub is a natural-gas benchmark, not a delivered LNG price. Propane is a producer-price index; industrial-gas output does not measure LNG production.
What to watch: Liquefaction and industrial-gas capacity, customer conversions, supply interruptions and regional delivery networks.
Related reporting

Heavy-Duty Truck Excise Tax Repeal: 7 Powerful Benefits and Risks for Tank Fleets
Heavy-duty truck excise tax repeal could lower upfront equipment costs for tank fleets, but it would also reopen major Highway Trust Fund and road-funding…

TerraVest Acquires Superior Pressure Vessels in Pressurized Tank-Trailer Expansion
The TerraVest SPV acquisition adds Calgary-based pressure-vessel manufacturing, repair, inspection and parts capabilities to TerraVest’s growing specialized tank-equipment portfolio, but important financial and integration…

Global Refinery Crunch: 8 Critical, Sobering Findings on Diesel and Jet Fuel
Updated global refinery crunch analysis covering Russian and Middle East refinery attacks, company responses, diesel and jet fuel exposure, and what the evolving 2026…
Liquid Waste & Environmental Services
Browse coverageWastewater, sludge, used oil and industrial waste connect collection fleets with treatment, recycling and recovery facilities.
History & comparisons — U.S. Public Water-Supply Construction Spending
2025-07-01 – 2026-08-01 · 14 observations
USD · million (SAAR)
Point to the chart, or focus it and use the left and right arrow keys, to inspect recorded values.
Available history only. Lines connect recorded observations; values between them are not supplied.
Recorded values
| Observation date | Value (USD · million (SAAR)) |
|---|---|
| 2025-07-01 | $34,678 million (SAAR) |
| 2025-08-01 | $34,844 million (SAAR) |
| 2025-09-01 | $35,898 million (SAAR) |
| 2025-10-01 | $36,473 million (SAAR) |
| 2025-11-01 | $35,281 million (SAAR) |
| 2025-12-01 | $34,030 million (SAAR) |
| 2026-01-01 | $33,823 million (SAAR) |
| 2026-02-01 | $34,205 million (SAAR) |
| 2026-03-01 | $34,019 million (SAAR) |
| 2026-04-01 | $34,433 million (SAAR) |
| 2026-05-01 | $34,984 million (SAAR) |
| 2026-06-01 | $34,818 million (SAAR) |
| 2026-07-01 | $35,049 million (SAAR) |
| 2026-08-01 | $35,451 million (SAAR) |
Latest observation comparisons
2026-08-01: $35,451 million (SAAR)
Year-over-year
+$607 million (SAAR) (+1.7%)
Compared with 2025-08-01: $34,844 million (SAAR).
Comparison dates & method
Comparisons use the latest observation above and stay the same when you change the chart period. They use the provider values currently held in the local history, including available revisions.
The yearly comparison uses the same reporting month in the previous calendar year.
History & comparisons — U.S. Sewage & Waste-Disposal Construction Spending
2025-07-01 – 2026-08-01 · 14 observations
USD · million (SAAR)
Point to the chart, or focus it and use the left and right arrow keys, to inspect recorded values.
Available history only. Lines connect recorded observations; values between them are not supplied.
Recorded values
| Observation date | Value (USD · million (SAAR)) |
|---|---|
| 2025-07-01 | $54,200 million (SAAR) |
| 2025-08-01 | $53,417 million (SAAR) |
| 2025-09-01 | $55,115 million (SAAR) |
| 2025-10-01 | $54,878 million (SAAR) |
| 2025-11-01 | $54,060 million (SAAR) |
| 2025-12-01 | $54,028 million (SAAR) |
| 2026-01-01 | $54,255 million (SAAR) |
| 2026-02-01 | $53,615 million (SAAR) |
| 2026-03-01 | $53,665 million (SAAR) |
| 2026-04-01 | $53,151 million (SAAR) |
| 2026-05-01 | $53,499 million (SAAR) |
| 2026-06-01 | $53,387 million (SAAR) |
| 2026-07-01 | $53,677 million (SAAR) |
| 2026-08-01 | $53,791 million (SAAR) |
Latest observation comparisons
2026-08-01: $53,791 million (SAAR)
Year-over-year
+$374 million (SAAR) (+0.7%)
Compared with 2025-08-01: $53,417 million (SAAR).
Comparison dates & method
Comparisons use the latest observation above and stay the same when you change the chart period. They use the provider values currently held in the local history, including available revisions.
The yearly comparison uses the same reporting month in the previous calendar year.
Water and waste construction spending describes infrastructure investment, not waste generation or vacuum-truck demand. Figures are seasonally adjusted annual rates.
What to watch: Treatment investment, environmental requirements, industrial activity, storm response and facility access.
Freight & Carrier Business Conditions
Browse coverageThe broader transportation cycle affects equipment, labor, operating costs, customer demand and competition across liquid and dry bulk.
History & comparisons — U.S. Truck Tonnage Index
2025-06-01 – 2026-07-01 · 14 observations
index (2015=100)
Point to the chart, or focus it and use the left and right arrow keys, to inspect recorded values.
Available history only. Lines connect recorded observations; values between them are not supplied.
Recorded values
| Observation date | Value (index (2015=100)) |
|---|---|
| 2025-06-01 | 113.2 index (2015=100) |
| 2025-07-01 | 113.9 index (2015=100) |
| 2025-08-01 | 115.0 index (2015=100) |
| 2025-09-01 | 113.7 index (2015=100) |
| 2025-10-01 | 112.2 index (2015=100) |
| 2025-11-01 | 113.2 index (2015=100) |
| 2025-12-01 | 113.1 index (2015=100) |
| 2026-01-01 | 114.2 index (2015=100) |
| 2026-02-01 | 115.8 index (2015=100) |
| 2026-03-01 | 117.5 index (2015=100) |
| 2026-04-01 | 116.3 index (2015=100) |
| 2026-05-01 | 112.8 index (2015=100) |
| 2026-06-01 | 114.4 index (2015=100) |
| 2026-07-01 | 113.5 index (2015=100) |
Latest observation comparisons
2026-07-01: 113.5 index (2015=100)
Year-over-year
−0.4 index points (−0.4%)
Compared with 2025-07-01: 113.9 index (2015=100).
Comparison dates & method
Comparisons use the latest observation above and stay the same when you change the chart period. They use the provider values currently held in the local history, including available revisions.
The yearly comparison uses the same reporting month in the previous calendar year.
History & comparisons — Freight Transportation Services Index
2025-06-01 – 2026-07-01 · 14 observations
index (2000=100)
Point to the chart, or focus it and use the left and right arrow keys, to inspect recorded values.
Available history only. Lines connect recorded observations; values between them are not supplied.
Recorded values
| Observation date | Value (index (2000=100)) |
|---|---|
| 2025-06-01 | 137.0 index (2000=100) |
| 2025-07-01 | 138.5 index (2000=100) |
| 2025-08-01 | 138.9 index (2000=100) |
| 2025-09-01 | 138.0 index (2000=100) |
| 2025-10-01 | 136.7 index (2000=100) |
| 2025-11-01 | 137.2 index (2000=100) |
| 2025-12-01 | 136.9 index (2000=100) |
| 2026-01-01 | 136.3 index (2000=100) |
| 2026-02-01 | 138.4 index (2000=100) |
| 2026-03-01 | 139.3 index (2000=100) |
| 2026-04-01 | 138.2 index (2000=100) |
| 2026-05-01 | 135.3 index (2000=100) |
| 2026-06-01 | 136.6 index (2000=100) |
| 2026-07-01 | 135.7 index (2000=100) |
Latest observation comparisons
2026-07-01: 135.7 index (2000=100)
Year-over-year
−2.8 index points (−2.0%)
Compared with 2025-07-01: 138.5 index (2000=100).
Comparison dates & method
Comparisons use the latest observation above and stay the same when you change the chart period. They use the provider values currently held in the local history, including available revisions.
The yearly comparison uses the same reporting month in the previous calendar year.
History & comparisons — U.S. Industrial Production
2025-08-01 – 2026-09-01 · 14 observations
index (2017=100)
Point to the chart, or focus it and use the left and right arrow keys, to inspect recorded values.
Available history only. Lines connect recorded observations; values between them are not supplied.
Recorded values
| Observation date | Value (index (2017=100)) |
|---|---|
| 2025-08-01 | 101.6 index (2017=100) |
| 2025-09-01 | 101.7 index (2017=100) |
| 2025-10-01 | 101.2 index (2017=100) |
| 2025-11-01 | 101.0 index (2017=100) |
| 2025-12-01 | 101.5 index (2017=100) |
| 2026-01-01 | 101.0 index (2017=100) |
| 2026-02-01 | 101.9 index (2017=100) |
| 2026-03-01 | 101.7 index (2017=100) |
| 2026-04-01 | 102.6 index (2017=100) |
| 2026-05-01 | 102.7 index (2017=100) |
| 2026-06-01 | 103.0 index (2017=100) |
| 2026-07-01 | 103.2 index (2017=100) |
| 2026-08-01 | 103.3 index (2017=100) |
| 2026-09-01 | 104.0 index (2017=100) |
Latest observation comparisons
2026-09-01: 104.0 index (2017=100)
Year-over-year
+2.3 index points (+2.2%)
Compared with 2025-09-01: 101.7 index (2017=100).
Comparison dates & method
Comparisons use the latest observation above and stay the same when you change the chart period. They use the provider values currently held in the local history, including available revisions.
The yearly comparison uses the same reporting month in the previous calendar year.
Port cargo · Houston Ship Channel
Monthly foreign-trade cargo across the Houston Ship Channel region, reported in short tons.
An earlier report is shown. Check the source for its latest figures.
Exports
15,964,874 short tonsJul 2026
+12.8% year over year
Jul 2025: 14,152,045 short tons
Imports
4,543,567 short tonsJul 2026
−2.5% year over year
Jul 2025: 4,659,145 short tons
Report released Sep 22, 2026. Source: U.S. Census Bureau via Port Houston.
Coverage includes all cargo types across the region, beyond Port Houston public terminals. It is not a bulk-only measure, a national ports index, or live congestion and waiting-time data.
Truck tonnage covers for-hire trucking broadly. Freight TSI combines multiple transportation modes. Neither is a tank-truck demand or rate index.
What to watch: Carrier costs and capacity, truckload conditions, manufacturing activity, rail and barge service, ports and labor disruptions.
Related reporting

New DataQs Review Process: What Tank Fleets Need to Know
Three-stage DataQs review is now required for states. Tank fleets need complete evidence, a deadline calendar and a clear distinction between record corrections, court…

UP–Norfolk Southern Merger: CN Deal Rewrites the Competition Map for Bulk Shippers
CN’s Midwest access agreement and a July 27 supplemental filing add real competition and service safeguards to the proposed transcontinental railroad—but the protections are…
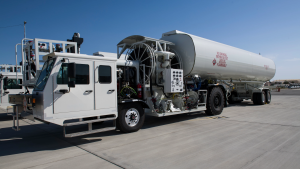
Stephens Pneumatics Selected to Supply Military Agile Fuel Systems
Stephens joins a military fuel-equipment procurement that separates pump systems from collapsible storage bladders, building on its aircraft-refueler experience.
Industry outlooks & reports
Follow the original reports for tank-truck benchmarks, broader freight conditions and carrier business costs.
ATA Truck Tonnage & Industry Data (opens in a new tab)
Broad for-hire trucking activity. Public releases summarize the index; the fuller monthly report is a subscription product.
NTTC Tank Truck Market Analysis (opens in a new tab)
Tank-truck tonnage, revenue and fleet analysis across commodity groups. The published market study is purchased separately.
TCA Profitability Program (opens in a new tab)
Carrier cost, utilization and profitability benchmarking. Detailed results are available through program participation.
DAT Trendlines & Market Analysis (opens in a new tab)
Van, reefer and flatbed spot-market rates and capacity. These equipment categories provide adjacent freight context, not tanker rates.
ATRI Operational Costs of Trucking (opens in a new tab)
Industry research on carrier operating expenses, including labor, equipment, fuel and maintenance.
USDA Grain Transportation Report (opens in a new tab)
Grain movements, freight rates and conditions across truck, rail, barge and ocean transportation.
STB Weekly Rail Service Data (opens in a new tab)
Official railroad reports covering carloads, train speeds, terminal dwell and cars held. Measures and coverage vary; compare matching series over time.
BTS Freight Transportation Services Index (opens in a new tab)
The quantity of freight carried by the for-hire transportation industry across multiple modes, with methodology and scope explained by BTS.
Market data may be delayed or end-of-day and is provided for informational context only.