- Containers carried 64% of waterborne U.S. DDGS exports in January–August 2026, according to USDA.
- Export growth creates opportunities around transloading, but the inland route determines which carriers benefit.
- Product condition, receiving capacity and container schedules deserve attention alongside freight rates.
U.S. DDGS container exports are gaining ground, changing the transportation choices facing ethanol producers, feed exporters and dry-bulk logistics providers. In its October 29 Grain Transportation Report, USDA reported that January–August waterborne containerized shipments increased 42% from a year earlier, while bulk-vessel shipments declined 14%.
Distillers’ dried grains with solubles, or DDGS, are an animal-feed coproduct of ethanol production. For bulk carriers, the practical question is where that material enters a container. A shipment can reach an inland packing facility by truck or travel farther in a railcar before being transferred closer to the port.
Tank Transport’s operational reading is that the shift warrants a closer look at individual loading points and contracts. Export statistics describe a market opportunity; they do not establish additional truckloads, longer hauls or higher margins for a particular fleet.


DDGS Export Growth Has More Than One Measure
The Renewable Fuels Association’s November trade update puts total U.S. DDGS exports through September at 9.66 million metric tons, up 12% from the same period in 2025. September alone accounted for 1.09 million metric tons, down 16% from August. Those figures cover all export modes through September, a broader measure and later reporting period than USDA’s January–August waterborne comparison.
USDA’s container share rose from 40% in January–August 2022 to 64% in the corresponding 2026 period. That is a 24-percentage-point increase. The report attributes the container gains partly to Asian buyers’ preference for smaller, more frequent deliveries, along with bulk-shipping constraints and container flexibility.
The 64% figure applies to waterborne exports, not all U.S. DDGS exports. The underlying waterborne series excludes land-border movements. It also does not identify the truck-versus-rail split before cargo reaches the vessel.
These distinctions matter when turning an export headline into a sales plan. A carrier needs the origin, receiving facility, equipment specification, and shipment frequency before estimating available work. Tank Transport’s coverage of the CHS soybean project’s separate oil and meal flows illustrates a related planning issue: processing volume and potential trucking demand are different measures.
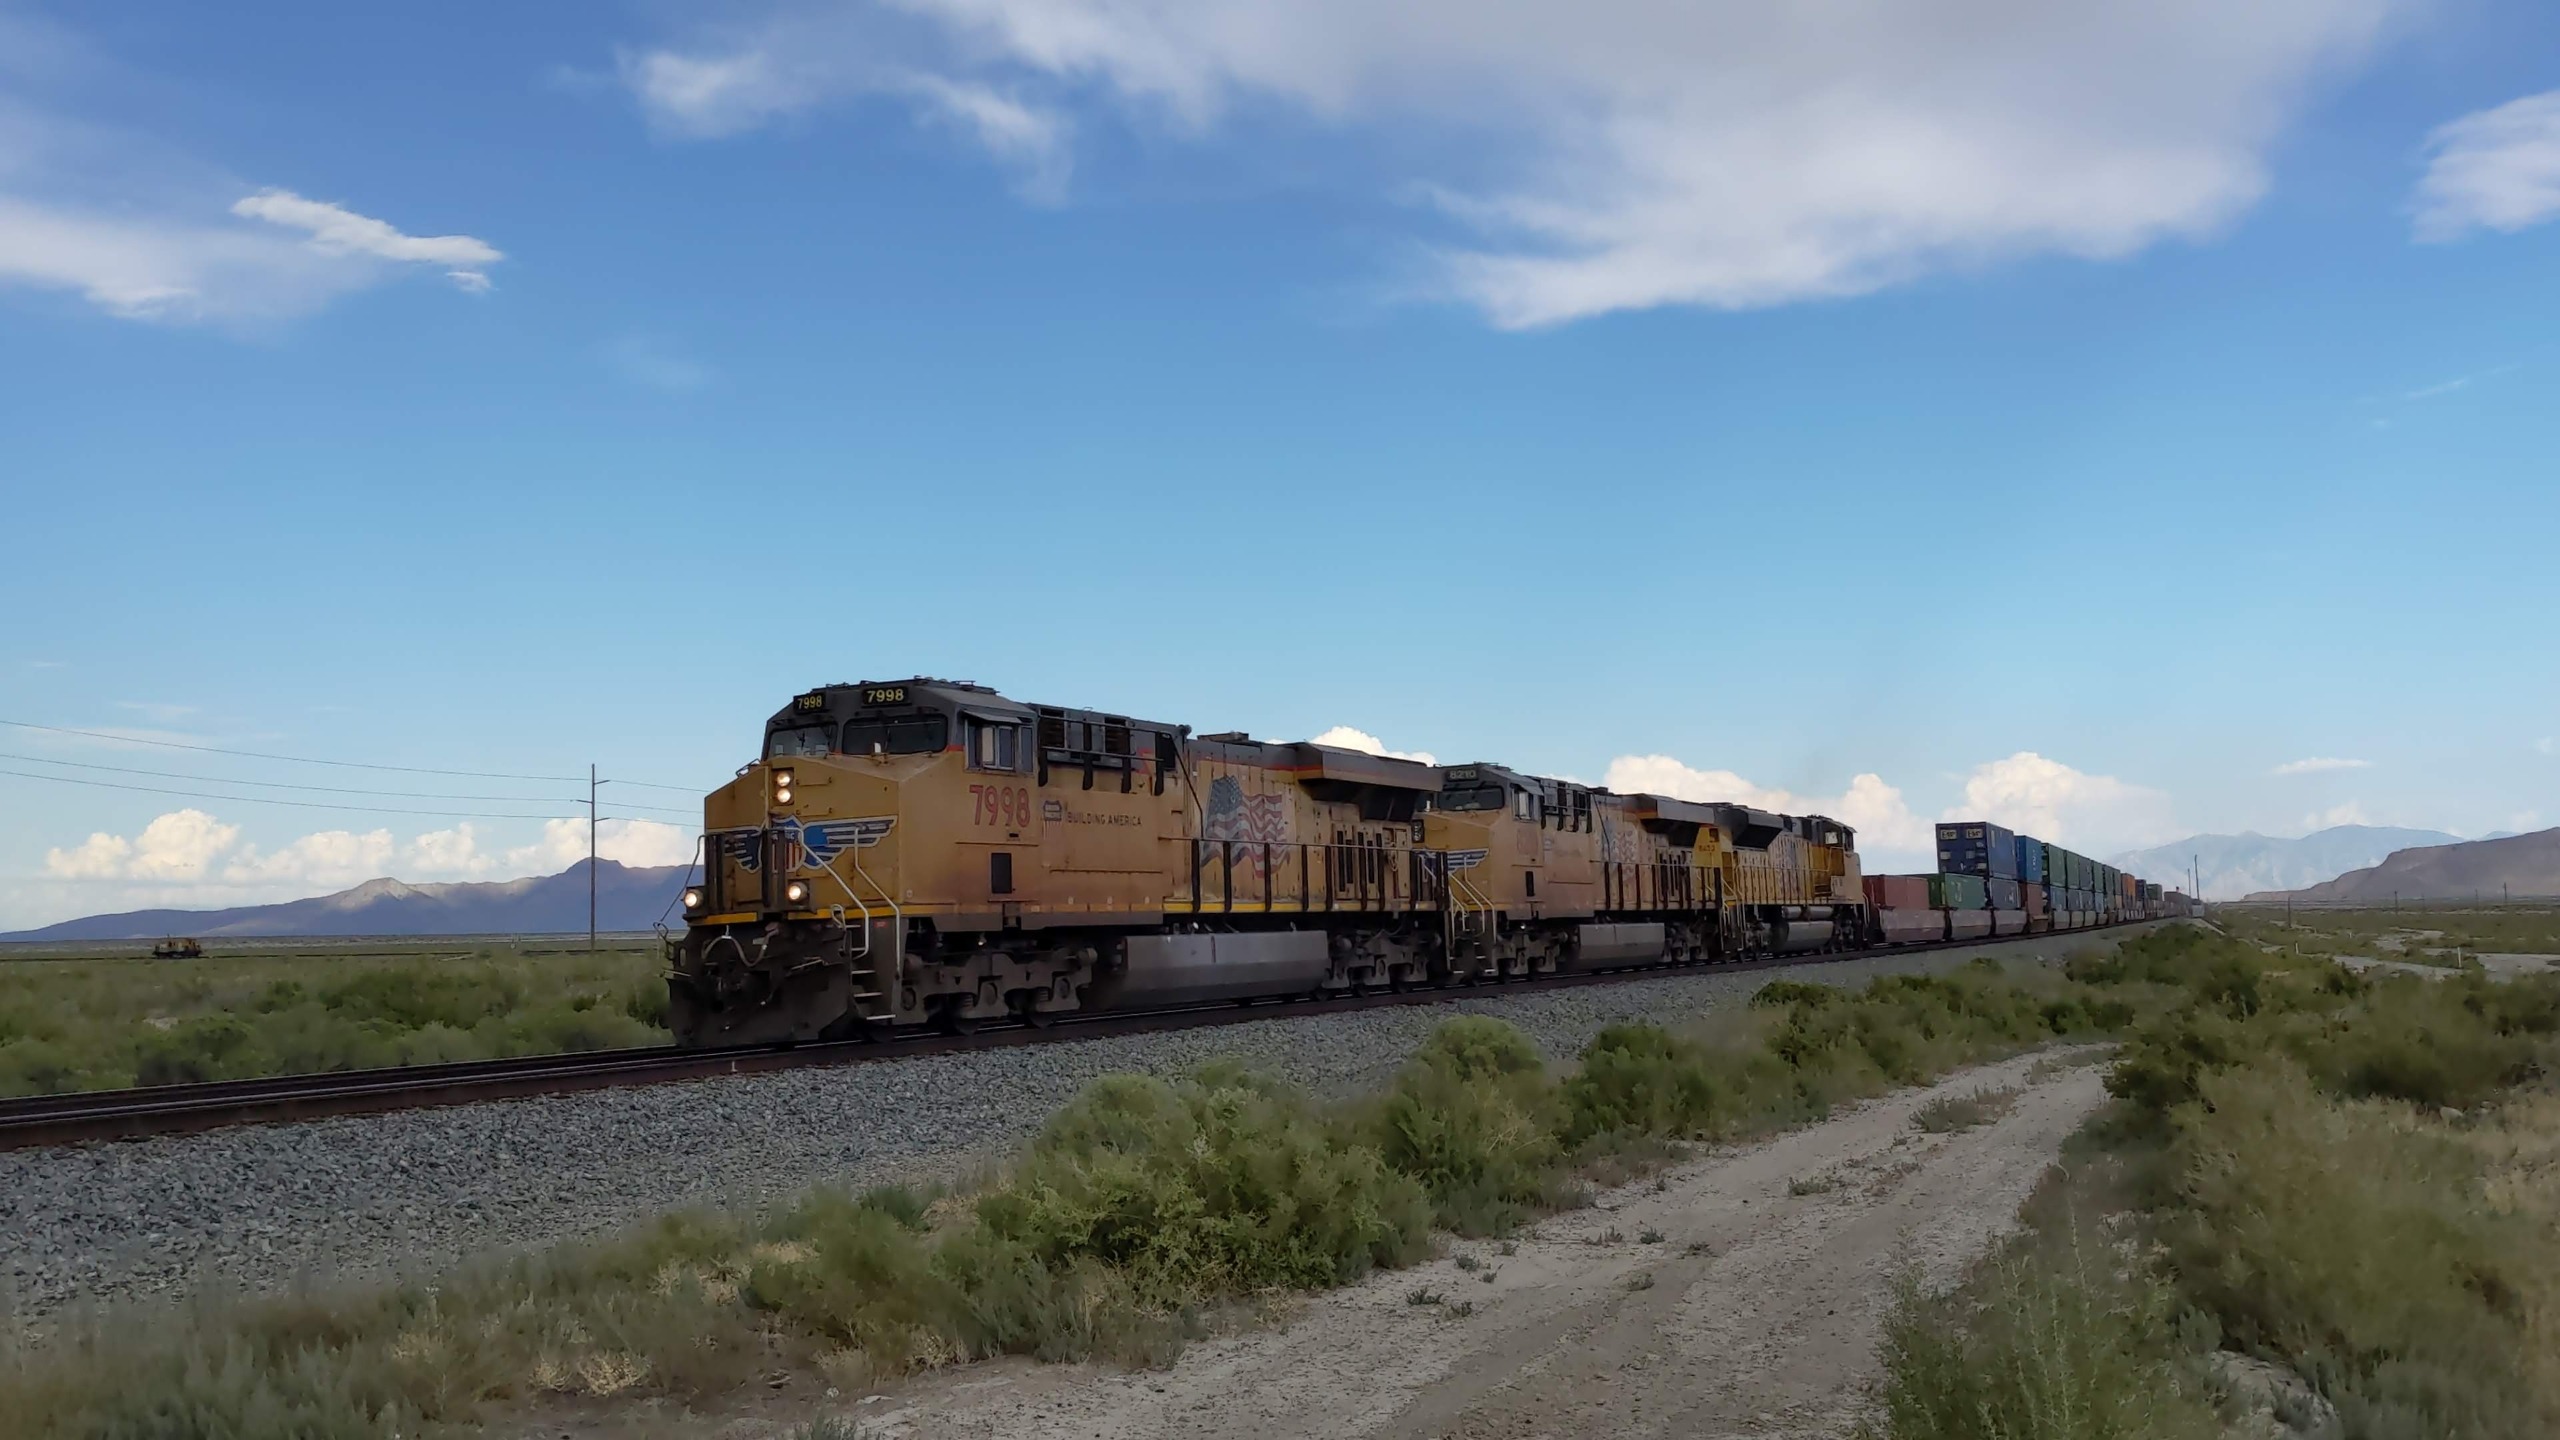
A westbound Union Pacific container train passes Delle, Utah, in September 2023. Its cargo is not identified as DDGS. (Photo: Braddah n8, CC BY-SA 4.0)
Where Containers Meet the Bulk-Hauling Network
Container shipping can retain a substantial inland bulk movement. The U.S. Identity Preserved Alliance’s transportation overview describes facilities transferring DDGS and other feed ingredients from trucks or hopper railcars into containers. It identifies transloading activity near Midwest rail ramps and coastal export gateways.
One documented example is Union Pacific’s Global 4 grain transload facility in Joliet, Illinois. Union Pacific describes a sequence in which regional producers deliver by truck, the product is loaded into marine containers, and the containers travel by rail to West Coast ports for ocean shipment. DDGS is among the products listed.
That example explains why a growing container market can support a regional bulk haul without creating a coast-to-coast truck move. The truck delivers loose material to the transloader; the loaded container follows a different transportation chain.
The reverse planning question arises when product moves most of the inland distance by hopper railcar. A coastal transloader may handle the transfer into containers, leaving a different role for trucking near the port. The Alliance documents this general rail-to-container model; the national export figures do not establish how much DDGS growth follows each route.
The location of the transfer into a container determines where the bulk haul ends and the container movement begins.Bulk hauling and container drayage therefore need separate operating assumptions. The receiving facility’s unloading method should determine acceptable trailer equipment. A fleet should not treat growth in containerized feed exports as an automatic increase in pneumatic-tank work.
The broader service model is familiar in dry bulk: trucking can be sold alongside warehousing and transloading, as Tank Transport’s earlier coverage of Bulkmatic’s terminal and logistics expansion shows. For a DDGS bid, the key question is which services the customer actually needs, and which party controls the handoff between them.

DDGS can enter an export container inland or near the port, creating different roles for bulk trucks and railcars. Routes are illustrative. (Graphic: Tank Transport; sources: Union Pacific and U.S. Identity Preserved Alliance)
Storage and Unloading Remain Product-Specific
A container does not remove DDGS handling challenges. Chapter 9 of the U.S. Grains Council’s DDGS handbook explains that moisture, temperature, particle characteristics, and storage conditions affect flowability. Warm product loaded before moisture equilibrates can harden during transport. Humid conditions can also contribute to caking and bridging.
The handbook further identifies variation in bulk density and particle segregation as challenges when loading railcars and containers. In practice, an assumed payload should be checked against the actual product and loading arrangement, not copied from a previous shipment.
For operators, those findings support a specific pre-shipment discussion: establish product acceptance criteria, the intended storage interval, and a compatible unloading method. Responsibility for a delayed or difficult unload should be agreed before dispatch. These are operating questions, not a universal temperature or holding-time specification.
A useful service measure is the elapsed time from arrival to completed unloading. Recording that time by facility and product condition can help a carrier distinguish a slow receiving process from a problem associated with a particular load. Without that distinction, a quoted turnaround assumption is difficult to defend.

An archival USDA photograph shows dried distiller’s grains stored at an ethanol plant in West Burlington, Iowa. (Photo: Steven Vaughn, USDA Agricultural Research Service)
Price the Complete Move and Its Handoffs
The commercial comparison should cover the full movement. A bulk-haul quote, a transload charge, and a container ocean rate cover different tasks. Comparing them requires clarity on included services, timing, and who pays when the schedule changes.
Global 4’s published service description shows the level of detail involved. Its listed package includes container drayage, a defined chassis allowance, a bulkhead, an export seal, and specified analysis, weight, and inspection documents. Those inclusions describe that facility’s offer; other terminals’ terms need to be checked individually.
Weight documentation also has a distinct maritime purpose. Under the International Maritime Organization’s verified gross mass requirements, the shipper is responsible for providing the packed container’s verified weight in time for vessel-stowage planning. That information is a condition of loading onto a covered ship. The parties should identify who obtains the weight and transmits it; an inbound commodity weight alone is not the packed container’s gross mass.
The following questions turn those separate tasks into a practical shipment review. They are planning checks, not evidence that any particular terminal is experiencing delays.
| Handoff | Confirm before dispatch | Commercial question |
|---|---|---|
| Plant to transloader | Product acceptance, trailer compatibility and receiving appointment. | Who pays for waiting or a rejected delivery? |
| Bulk to container | Packing slot, product identification, payload and required documents. | What handling and storage does the quote include? |
| Container to rail or port | Equipment release, receiving window and shipment cutoff. | Who handles rebooking or an additional move? |
| Vessel loading | Booking status and timely verified gross mass submission. | Who coordinates recovery if the shipment misses sailing? |
The practical priority is to assign responsibility at each handoff. A low initial rate is difficult to evaluate if the agreement leaves waiting time, storage, or a second delivery unresolved.
Before dedicating equipment to a new lane, operators can request a trial movement and compare quoted assumptions with actual receiving, unloading, and release times. The result provides a firmer basis for pricing than extrapolating from a national export growth rate.
For ongoing market review, combine customer bookings and facility performance with broader indicators, including the diesel and grain-transport data in Tank Transport’s Market Hub. Those indicators supply context; shipment commitments and measured cycle times establish the work a fleet can plan around.
DDGS Container Exports: Key Developments
- Containers gained waterborne export share; the data do not measure inland truck demand.
- Total DDGS exports reached 9.66 million metric tons through September, up 12% year over year, according to RFA.
- Inland truck-to-container and coastal rail-to-container arrangements create different hauling opportunities.
- Product condition, unloading capability, and responsibility for schedule changes belong in the operating plan.